The Statistical Tests Used in the Literature on Conditioned Place Preference Induced by Nicotine in Mice Are Underpowered
François Léonard1 & Ezio Tirelli2
- 1Department of Education, University of Liège, Liège, Belgium
- 2Board of Ethics and Scientific Integrity, University of Liège, Liège, Belgium
Abstract
Introduction: In recent decades, concerns have been raised about the validity and reliability of many research results. Inadequate research practices, including insufficient statistical power, have contributed to the replication crisis. The statistical tests of numerous studies in the neurobehavioral sciences are often underpowered, with inflated effect sizes and high rates of false discoveries. To explore these issues in experimental psychopharmacology, this study focused on the rewarding effects of nicotine using the conditioned place preference (CPP) task in mice. Methods: We assessed, across a set of selected articles, whether the statistical power of the included tests, calculated using external small, medium, and large hypothetical effect sizes (Cohen’s f and d), reached the conventional .80 threshold, and how these powers related to the observed effect sizes. We also examined the association between observed effect sizes and sample sizes and estimated Positive Predictive Value (PPV) and False Discovery Rate (FDR) for pre-study probabilities of H1 being true ranging from .001 to .99. Results: Across 61 articles (1995–2024) comprising 129 statistical tests, all calculated powers fall below the conventional 0.80 threshold for small and medium hypothetical effect sizes, and only 7.1 to 41.7 percent reach this level for large effect sizes. None of the studies report a complete and justified power analysis or any other formal sample size justification. Effect sizes are negatively related to both power and sample size, with smaller, underpowered studies tending to report inflated effects. As a result, many studies, especially those with low or medium levels of pre-study probabilities, show reduced PPV and elevated FDR. Discussion: This study highlights the lack of statistical power in CPP nicotine research in mice, suggesting that much of the published evidence may be unreliable, inflated, or difficult to replicate. We encourage researchers, while providing a few avenues for reflection, to identify the smallest effect sizes that meaningfully capture nicotine CPP and, on this basis, to define realistic hypothetical effects for sample size planning.
Keywords: meta-research, hypothetical effect sizes, statistical power, false discovery rate, conditioned place preference, nicotine

Purpose
Despite growing awareness of underpowered studies and inflated effect sizes in confirmatory research, many domains have yet to be systematically scrutinized in this regard. To our knowledge, no study has assessed statistical power or its link to reported effect sizes in animal research within experimental and preclinical psychopharmacology. We therefore focused on a well-defined paradigm, nicotine-induced conditioned place preference (CPP) in mice, to examine these issues.
The literature on nicotine-induced conditioned place preference in mice relies on statistical tests that are typically underpowered (to detect effect sizes smaller than those reported), often accompanied by overestimated effects, with no study to date providing a correct and comprehensive justification of sample size based on a minimally relevant effect size. Addressing these shortcomings is essential to ensure the robustness and replicability of future findings in this area.
Introduction
In recent decades, the scientific community has become increasingly aware of the problem of reproducibility and replicability in published confirmatory research findings. This concern stems from the observation that many study results cannot be reproduced reliably, casting doubt on their validity (Begley & Ioannidis, 2015; Errington et al., 2021; Munafò et al., 2017; Open Science Collaboration, 2015). A substantial body of literature has identified numerous probable contributing factors, across a range of scientific fields. Among these factors, a broad spectrum of inadequate or questionable research practices stands out as particularly influential (John et al., 2012; van Calster et al., 2017). While the literature describes a multitude of such practices, the following are among the best characterized examples: the prioritization of statistically significant effects coupled with misconceptions about the p-value (Gigerenzer, 2018; Greenland et al., 2016; Halsey et al., 2015; Lytsy et al., 2022); excessive flexibility in study design and data analysis (Motulsky, 2014; Patel et al., 2015; Simmons et al., 2011); flawed experimental methodology or statistical approaches, often involving multiple errors (Altman, 1994; Darling, 2024; Nieuwenhuis et al., 2011; Smith, 2017); and insufficient statistical power, which is considered as one of the most pervasive and detrimental threats to the reliability of scientific findings (Bishop, 2019; Button et al., 2013; Ioannidis, 2005).
Let us recall that statistical power is the probability of obtaining a statistically significant result, given that the effect truly exists, for a specific combination of experimental design, statistical test, type I error rate, and hypothetical (expected) effect size. In practice, one of its primary roles is during the planning stage of an experiment, where it is used to determine the sample size required for the statistical test to detect the hypothetical effect size at an optimal power and a prespecified significance level.
It is generally accepted that optimal statistical power should reach or exceed .80. However, a substantial body of meta-research has shown that this conventional threshold is routinely unmet in studies reporting statistically significant results, across fields such as psychological sciences (Fraley & Vazire, 2014; Hussey, 2023; Stanley et al., 2018; Szucs & Ioannidis, 2017), neuroscience (Button et al., 2013; Dumas-Mallet et al., 2017; Mitra et al., 2019; Quintana, 2020; Szucs & Ioannidis, 2017), experimental medicine and clinical health research (de Vries et al., 2023; Gaeta & Brydges 2020; Kinney et al., 2020; Lamberink et al., 2017; Turner et al., 2013), economics (Ioannidis et al., 2017), animal-based experimental research (Bonapersona et al., 2021; Button et al., 2013; Carneiro et al., 2018), and the natural sciences (Cleasby et al., 2021; Jennions & Møller, 2003; Smith et al., 2011; Yang et al., 2023). Across these domains, underpowered tests often fail to detect potentially relevant effects smaller than those highlighted in the very studies where they are applied. In the case of non-significant results, such failures may reflect insufficient sensitivity rather than the true absence of an effect, leading to false negatives (Cohen, 1962; Giuffrida, 2014; Hofmeister et al., 2007; Moher et al., 1994; Quintana, 2020).
Yet this overall picture is not without exceptions. In some neuroscientific fields, a substantial share of statistically significant tests reaches adequate power (Nord et al., 2017), whereas in certain medical domains relying on cognitive and behavioral outcomes, well-powered tests may even form nearly three-quarters of the sample studied (Dumas-Mallet et al., 2017). Such diversity, although limited, underscores the importance of field-specific meta-research when assessing how pervasive low statistical power really is.
More generally, across the broad range of scientific domains examined to date, little convincing evidence of overall improvement has emerged since Cohen’s pioneering work (1962), which first highlighted the problem of low statistical power in abnormal and social psychology. Nonetheless, some fields have made notable progress. For instance, between 2013 and 2019, social psychology saw increasing sample sizes and statistical power, reaching optimal levels by around 2017, partly thanks to online participants (Fraley et al., 2022; Hussey, 2023; Sassenberg & Ditrich, 2019). These trends suggest that growing awareness of the issue is starting to bring tangible benefits within specific research communities.
Importantly, observed effect sizes tend to be inflated in studies with small sample sizes, high variability, and low statistical power. This arises because a wide sampling distribution allows observed effects to deviate substantially from the true effect especially at the smallest p-values, a statistical phenomenon known as a Type M (Magnitude) error (Gelman & Carlin, 2014; Halsey et al., 2015). When statistical significance is used as a selection criterion, only the largest observed effects have a chance to reach statistical significance under low power, leading to systematic overestimation of the effect size, the Winner’s Curse (Ioannidis, 2008). The published literature may further amplify this inflation through publication bias, which preferentially retains statistically significant findings (Ioannidis, 2005). A negative relationship has been described between the observed effect size and the sample size or the power in large sets of articles and tests dealing with clinical trials meta-analyses (Ioannidis, 2008; Pereira & Ioannidis, 2011), various areas of psychological research (Kühberger et al., 2014; Szucs & Ioannidis, 2017), neurocognitive and health sciences (Button et al., 2013; David et al., 2013; Dumas-Mallet et al., 2017; Szucs & Ioannidis, 2017), and behavioral ecology and evolutionary biology (Cleasby et al., 2021). This relationship has also been documented in more thematically focused analyses, including animal models of stroke treatments (Schmidt-Pogoda et al., 2019), multiple sclerosis (Vesterinen et al., 2010), the effects of high-intensity interval training on health (Ekkekakis et al., 2023), and the behavioral effects of intranasal oxytocin in humans (Quintana, 2020; Walum et al., 2016). Published inflated effect sizes can mislead sample size calculations and produce underpowered tests, thereby weakening studies whose design relies directly on such estimates (see for example the Bayesian modeling by Etz and Vandekerckhove, 2016).
Another important consequence of low power and small sample sizes is a fall in the probability that the reported statistically significant effects are true (the positive predictive value, PPV) and, complementarily, an increase in the probability that these effects are false (the false discovery rate, FDR). The calculation of PPV and FDR, which are post-study probabilities, incorporates the pre-study probabilities (prior odds or plausibility) that the alternative hypothesis (H1) is true given a statistically significant result (existence of an effect). With low pre-study probabilities of H1 , low power can have severe consequences, leading to a substantial proportion of research findings being false, in other words attributable solely to chance. This has been illustrated both in the studies cited above and in others conducted in the same or closely related fields (Baldwin, 2017; Button et al., 2013; Ekkekakis et al., 2023; Ioannidis, 2005; Lodder et al., 2019; Schmidt-Pogoda et al., 2019; Schrenck, 2023; Szucs & Ioannidis, 2017; Walum et al., 2016; Wilson & Wixted, 2018).
Although the lack of statistical power and the inflation of effect sizes are likely widespread in confirmatory research, it must be acknowledged that this issue remains under-investigated in many research domains. This acknowledgement is especially necessary given that some fields, which may represent exceptions, do not appear to have been, or are no longer, as severely affected by low statistical power (Dumas-Mallet et al., 2017; Hussey 2023; Nord et al., 2017). This suggests that power-related issues may be unevenly distributed across disciplines and subfields, warranting more targeted investigations to determine where the problem is most acute and where improvements may already have taken place. To our knowledge, no systematic characterization of statistical power and its relationship with reported effect sizes has yet been conducted in the field of experimental or preclinical psychopharmacology using animal models, an area in which one of us (E.T.) has worked. We therefore undertook such an analysis, focusing on a representative and well-circumscribed area within this field: the assessment of nicotine’s rewarding effects using the conditioned place preference (CPP) task in mice.
Usually, the CPP takes place in an apparatus comprising two equally sized compartments that provide different sensorial cues. CPP relies on the association of the rewarding effects of a drug with one of the compartments in which the animal is placed for a few minutes after having received an injection of the drug. This operation is repeated several times, often every other day, once a day. On the intermediate days the same animal receives an identical number of injections of an ineffective saline solution before being placed in the other compartment. The control animal always receives injections of a saline solution. This conditioning phase is followed, at a given interval, by a test session on which the animal is allowed unrestricted access to both compartments. If the drug is rewarding, the animal will spend more time in the drug-associated compartment than in the other one (Prus et al., 2009). Preference scores are the number of seconds, or the percentage of time (sec) spent in the drug-paired compartment. In the biased procedure, the drug is always given in the least preferred compartment during a pre-conditioning habituation phase to the apparatus. In the unbiased procedure, both compartments are paired with the drug either alternately or at random. The preference test is classified as forced when the animal is initially placed in one of the conditioning compartments, and as unforced when a neutral central compartment is used as the starting point (free-choice). It seems that there is no clear-cut or robust empirical evidence readily available that the effectiveness of drug-induced place preference systematically differs depending on whether biased or unbiased procedures, or forced or unforced choice paradigms, are used.
Methods
Identification of Articles
We searched PubMed (August 28, 2019) to identify articles using nicotine-induced CPP in mice. We adopted the search string “conditioned place preference nicotine mice” and added the filter “other animals.” PubMed translated this search string as “((”conditioning (psychology)“[MeSH Terms] OR (”conditioning” [All Fields] AND “(psychology)”[All Fields]) OR “conditioning (psychology)”[All Fields] OR “conditioned” [All Fields]) AND place[All Fields] AND preference[All Fields] AND (“nicotine”[MeSH Terms] OR “nicotine”[All Fields]) AND (“mice”[MeSH Terms] OR “mice”[All Fields])) AND “animals”[MeSH Terms]“. An update of the search was conducted on February 4, 2025.
The first author (F.L.) performed the selection directly on the full text for his master’s thesis. The corresponding data were reanalyzed the following year during the first year of his doctoral degree to ensure computational reproducibility. In cases of doubt regarding a specific article, the final decision regarding in/exclusion was made after discussion with the second author. The following inclusion criteria were used: (1) research articles, (2) articles written in English, (3) articles involving only mice, (4) articles providing sufficient information for power and effect size computations, and (5) articles conducting statistical comparisons between values derived from either the saline and nicotine-treated groups (doses) during the test session, the pre-conditioning and post-conditioning conditions (test session) within the nicotine-treated group, or main effect of nicotine in a factorial design.
Data Extraction
Data were extracted from the included articles by the first author, using a LibreOffice Calc spreadsheet. In case of doubt during the extraction, the second author was consulted. The extracted data were based on the following characteristics of the study: first author, journal abbreviation, publication year, type of preference or choice required in the CPP (forced, unforced, unspecified), type of CPP procedure (biased, unbiased, unspecified), type of statistical tests (F-tests, unpaired-group t-tests, and paired-group t-tests), values of statistics, degrees of freedom, p-value, and sample size. Effect sizes were calculated from the values of statistics and degrees of freedom. Missing or incomplete sample sizes were computed using the degrees of freedom. Additionally, since none of the studies reported observed effect sizes, we calculated them using the statistical test value and the corresponding degrees of freedom (whenever possible). Missing p-values were calculated from the type of test, its value, and the degrees of freedom. Any tests and results that were not relevant to the main CPP outcome were disregarded.
Statistical Power: Calculations and Distributions
Any calculation of statistical power (
Relationship Between Observed Effect Size and Statistical Power
As t-tests and F-tests cannot be straightforwardly amalgamated to yield a singular, shared effect size, Cohen’s d was employed as the effect size for both unpaired- and paired-group t-tests, while Cohen’s f was utilized as the effect size for the F-tests. The Cohen’s d values for paired means were calculated following Borenstein and Hedges (2019), with the implied correlation between measurement occasions set at .59, as recommended by Balk et al. (2012). For F-tests, partial eta squared was first calculated and then converted to Cohen’s f (see Cohen, 1988).
For each of the six power analyses, each based on one of the three external conventional effect sizes, a linear regression line was added solely to visually illustrate the observed relationship between statistically significant effect sizes and recalculated power, without drawing any parametric inferences. The strength and significance of the monotonic association were instead assessed using Spearman’s rank correlation (s), which does not rely on parametric assumptions. The corresponding 95% confidence intervals were estimated via 10,000 bootstrap resamples, and the associated p-values are reported.
Relationship Between Observed Effect Size and Sample Size per Group
To visualize and assess the relationship between observed effect sizes and sample sizes per group, we proceeded in the same way as for the analysis of the relationship between observed effect sizes and statistical powers. A regression line and Spearman’s rank correlation (conventional critical value at .05) were computed only for the statistically significant F-tests and t-tests.
Positive Predictive Value (PPV) and False Discovery Rate (FDR)
The positive predictive value (PPV, also True Discovery Rate), which represents the probability that a statistically significant effect is a true discovery, not due to chance, was calculated using the formula
Data Analyses Software and Codes
We performed all computations in R version 4.5.1 (R Development Core Team, 2025). All power analyses were performed with the dedicated R-package “WebPower” version 0.9.4 (Zhang et al., 2023). Data and codes are available on the Open Science Framework (https://osf.io/nbksj/).
Results
Identification of Studies and Statistical Tests
Our PubMed search identified 139 articles published between 1995 and 2019 and 52 between 2019 and 2024, resulting in a total of 191 articles. Nine were excluded because they were not research studies, one because it was written in Japanese, and 11 because they did not use mice. Forty-four articles were excluded because they did not report a statistical comparison between the values derived from the saline and the nicotine-treated groups on the test session or from the pre-conditioning and the saline post-conditioning (test session) conditions within the nicotine-treated group. Finally, another set of 65 articles was excluded because they did not report enough data to allow for power and effect size calculations.
The remaining 61 articles reported 129 statistical tests: 89 F-tests and 40 t-tests including 23 unpaired- and 17 paired-group tests. Out of the 61 articles, 27 (44%) examine potential genetic differences. As regards the 89 F-tests, 43 of them came from articles using genetically modified mouse strains. On these 43 F-tests, 16 were on wild-type mice only and 27 studied both wild-type and genetically modified mice (all of these tests corresponded to the main effect of nicotine in a factorial design). Regarding the 40 t-tests, 20 tests were from articles examining possible genetic differences. From these articles, 12 t-tests studied wild-type mice only and the others both wild-type and genetically modified mice. Among the 89 F-tests, 72 (80.90%) were statistically significant at an alpha threshold of 5%, and among the 40 t-tests results, 28 (70.00%) were significant. Globally, 77.52% of the tests yielded a statistically significant result. The most utilized CPP design was the un-forced and un-biased design (59.02%), and the principal route of drug administration was subcutaneous (68.85%).
Distributions of Calculated Statistical Powers
Among all studies included in our analysis, only one reported a prospective sample size estimation based on power analysis. However, the absence of a scientific rationale for the chosen hypothetical effect size undermines the validity of this estimation, making it effectively equivalent to having provided no sample size justification at all.
Figure 1 shows the distributions of individual statistical powers derived from three external hypothetical effect sizes (f = 0.1, 0.25, and 0.4; d = 0.2, 0.5, and 0.8) for each test type, combining significant and non-significant results. The dataset includes 89 F-tests and 40 t-tests. None of the tests based on small or medium effect sizes reach the conventional .80 power threshold, with many individual powers as low as .05 or .10. This pattern is reflected in the median powers of .096 and .068 for the two smallest effects (Cohen’s f and d respectively), and, to a lesser extent, in the median powers of .345 and .170 for the two medium effect sizes. For large effect sizes, the median powers are higher, up to .705 for the F-tests, yet still below .80. Consistently, only 40.4% of the F-tests reach or exceed the .80 threshold. For the t-tests, the median power for the large effect size is .358, with only 10% meeting or exceeding this benchmark.
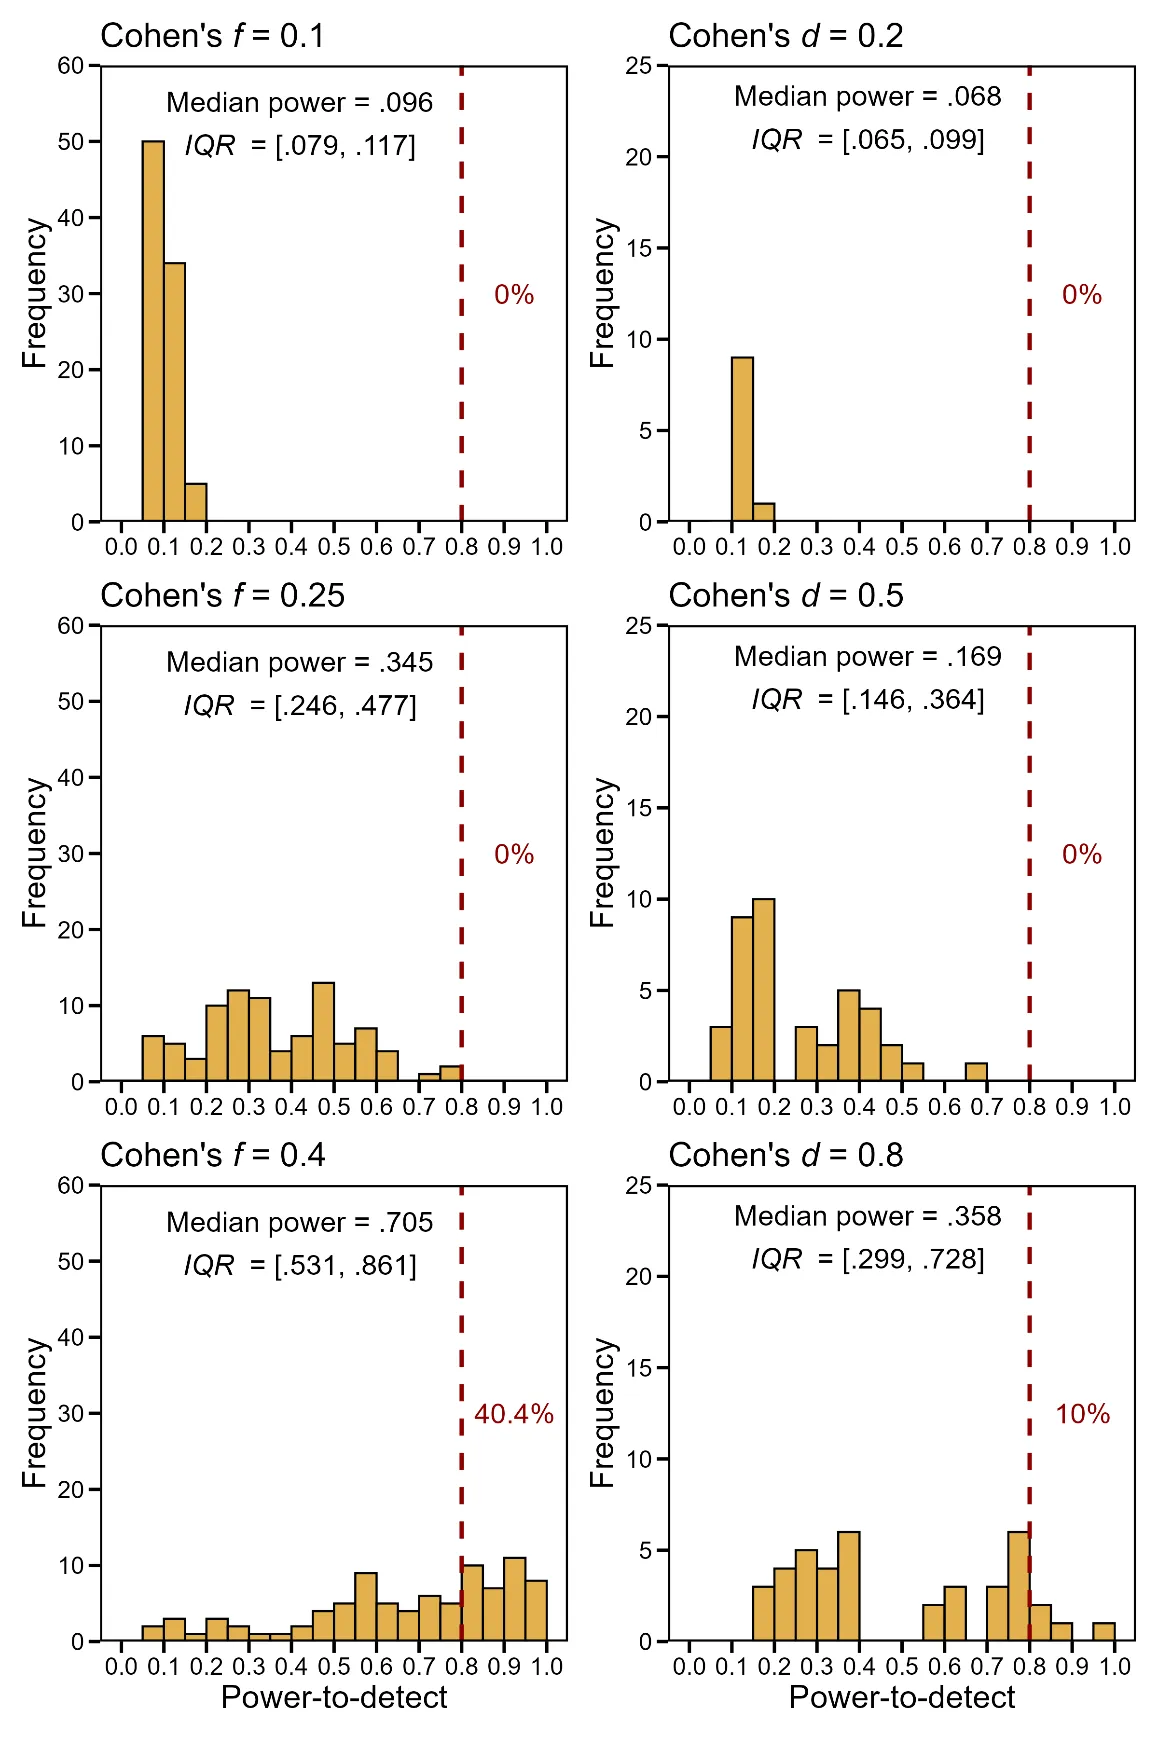
Distributions of statistical power to detect external small, medium, or large hypothetical effect sizes, across significant and non-significant combined tests. The three left-hand panels show results for F-tests (n = 89), and the three right-hand panels for t-tests (n = 40). Each panel displays the distribution of power estimates for detecting one of the external conventional effect sizes, Cohen’s f = 0.1, 0.25, 0.4 for F-tests, and Cohen’s d = 0.2, 0.5, 0.8 for t-tests, using the original sample size reported in the analyzed articles. The median power and interquartile range (IQR) are indicated within each panel. The vertical dashed line marks the conventional threshold of 0.80 for adequate statistical power. Percentages represent the proportion of tests with power-to-detect ≥ 0.8.
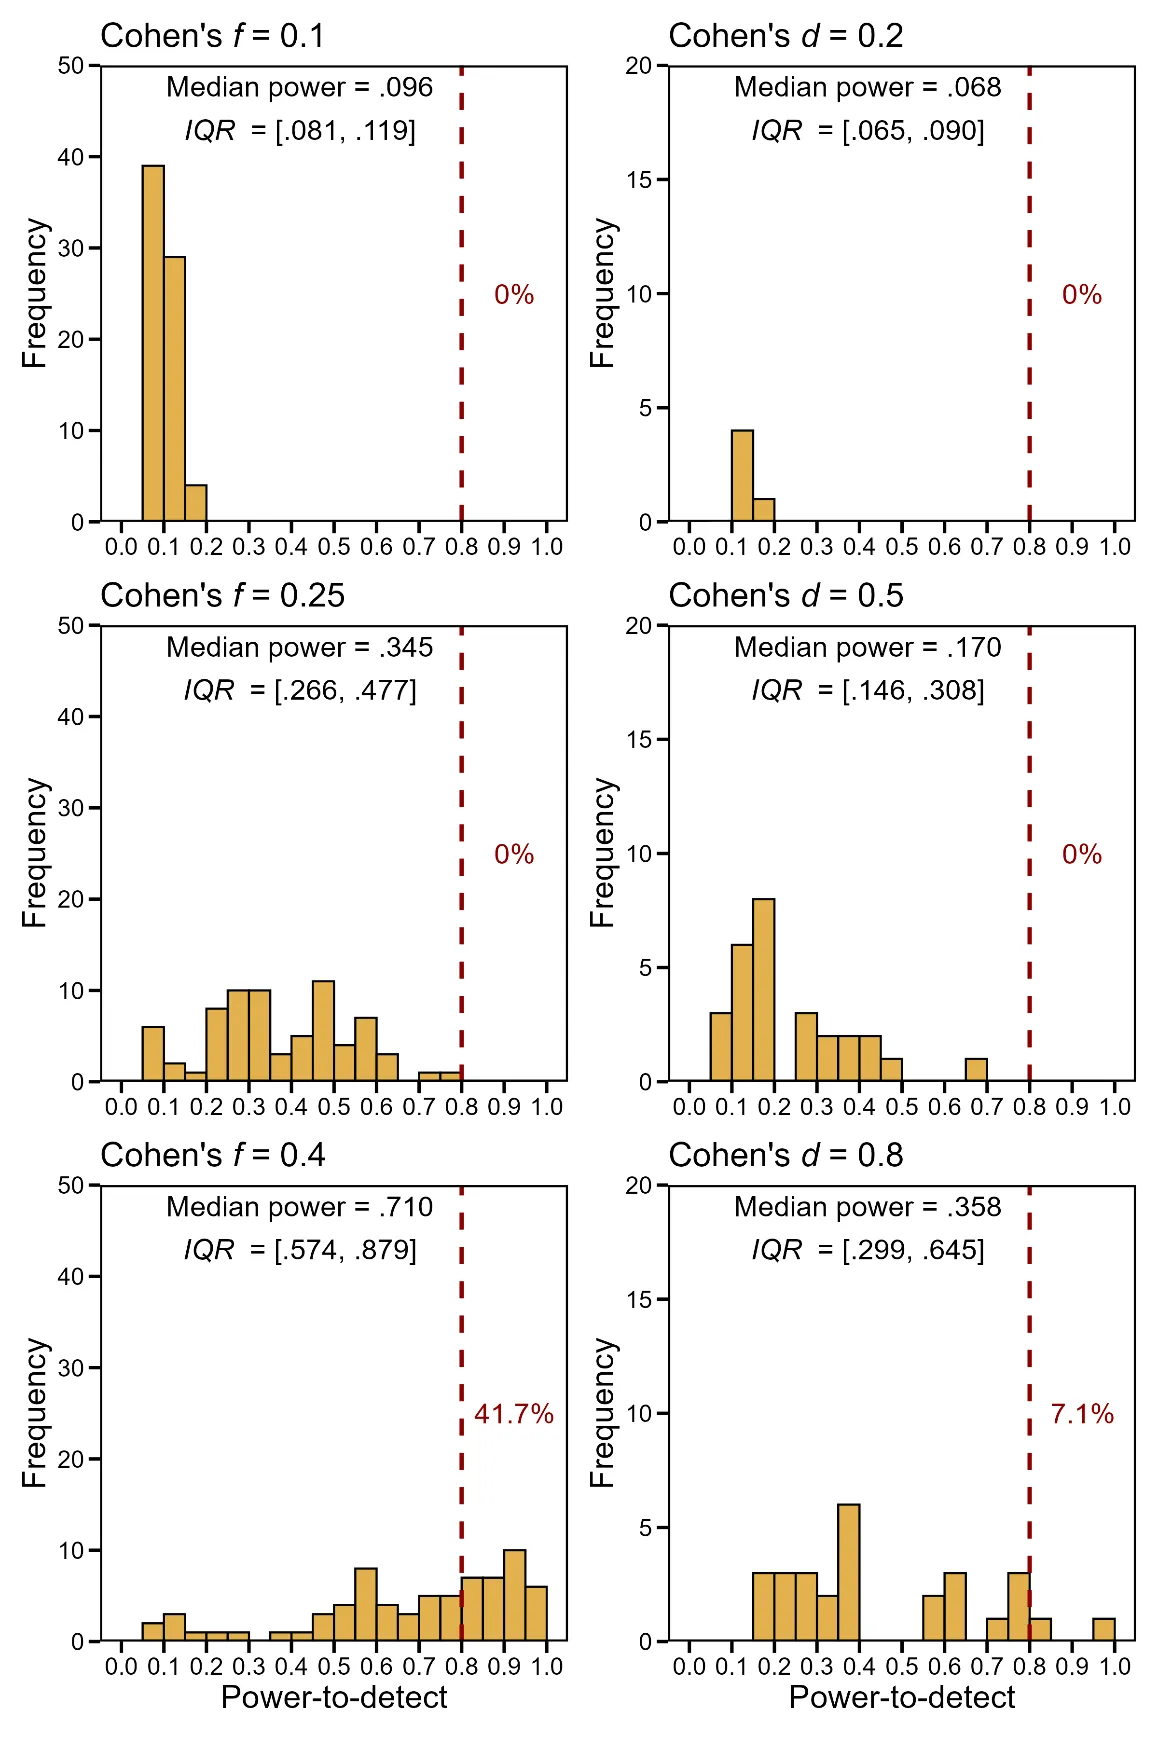
Distributions of statistical power to detect external small, medium, or large hypothetical effect sizes for the statistically significant tests. The left-hand panels correspond to F-tests (n = 72), and the right-hand panels to t-tests (n = 28). Each panel shows the distribution of power estimates for detecting one of the external conventional effect sizes, Cohen's f = 0.1, 0.25, 0.4 for F-tests, and Cohen's d = 0.2, 0.5, 0.8 for t-tests, based on the original sample size reported in the analyzed articles. The median power and interquartile range (IQR) are reported within each panel. The vertical dashed line marks the conventional threshold of 0.80 for adequate statistical power. Percentages represent the proportion of tests with power-to-detect ≥ 0.8.
Figure 2 shows the distributions of individual powers calculated using the three external hypothetical effect sizes (f = 0.1, 0.25, and 0.4; d = 0.2, 0.5, and 0.8) for each test type, considering only statistically significant results (72 F-tests and 28 t-tests). No tests based on small or medium effect sizes reach the conventional .80 power threshold, and many individual powers are close to .05 or .10. This results in very low median powers of .096 and .068 for the two smallest effects (Cohen’s f and d respectively), and, to a lesser extent, in median powers of .345 and .170 for the two medium effect sizes. Statistical powers are higher for the large effect sizes: for the F-tests, median values reach .710, with 41.7% attaining or surpassing .80 power; for the t-tests, the median power is only .358, with just 7.1% meeting this threshold. Notably, the median statistical powers are very similar, if not virtually identical, between significant and non-significant tests.
Figure 3 shows that, for the non-significant tests (17 F-tests and 12 t-tests), all individual powers obtained for the two smallest effect sizes (f = 0.1 and 0.25; d = 0.2 and 0.5) are well below the .80 threshold, regardless of the test type. In these four cases, the median powers are .088 and .097 for the smallest effects, and .300 and .353 for the medium effect sizes. For the largest effect sizes (f = 0.4 and d = 0.8), the distribution of individual powers is more variable, with 35.3% of F-tests and 16.7% of t-tests reaching or exceeding .80 power. The corresponding median powers are .630 and .714, respectively, substantially higher than those calculated for the smaller effect sizes. Overall, the pattern of results closely resembles that observed in the two other analyses (combining significant and non-significant tests, and significant tests only), despite the much smaller number of tests in this subset.
Test type | Effect size | ≤2008 | 2009-2013 | 2014-2017 | ≥2018 |
|---|---|---|---|---|---|
F-tests | Small | .108[.089, .119] | .098 [.088, .127] | .084[.075, .092] | .085[.070, .113] |
Medium | .434[.303, .477] | .360[.297, .540] | .270[.212, .329] | .277[.197, .480] | |
Large | .818[.637, .861] | .726[.640, .913] | .575[.455, 0.698] | .589[.453, .862] | |
t-tests | Small | .104[.081, .107] | .097[.085, .107] | .066[.065, .068] | .116[.088, .121] |
Medium | .396[.244, .410] | .353[.278, .410] | .152[.146, .170] | .465[.286, .491] | |
Large | .773[.466, .790] | .714[.591, .790] | .316[.299, .358] | .848[.525, .870] |
Table 1 shows the median statistical power (with interquartile ranges) of the included tests across publication-year quartiles. Statistical power related to F-tests tends to decline over time for the three hypothetical effect sizes, with consistently very low values for small effect sizes. For t-tests, a similar pattern appears across the first three publication-year quartiles with a slight increase in recent years, although power levels remain insufficient for small and medium effect sizes. Overall, there is no indication of meaningful improvement in the most recent years (since 2018).
Relationship Between Observed Effect Sizes and Statistical Powers
Figure 4 depicts the relationship between the observed effect sizes for the two types of statistically significant tests (Cohen’s f or Cohen’s d) and the powers recalculated from the three effect sizes used as hypothetical values in these power calculations. For the two smallest hypothetical effect sizes (f = 0.1 and d = 0.2), the observed effect sizes are distributed almost entirely along the vertical axis, with disproportionately large values suggesting strong overestimation. None corresponds to a power exceeding .2. With the two medium hypothetical effect sizes (f = 0.25 and d = 0.5), the observed effect sizes are more widely dispersed in relation to the recalculated powers, with several very large values associated with various power levels, but fewer approaching the .8 threshold. For these two hypothetical effect sizes, no test reaches or exceeds the minimally accepted power of .8. When powers are recalculated from the two larger hypothetical effect sizes (f = 0.4 and d = 0.8), several very large observed effect sizes again appear at various power levels, mostly below .8. However, unlike the previous cases, 41.7% of the observed f values and 7.1% of the observed d values exceed this threshold, most clustering around the corresponding hypothetical effect size.
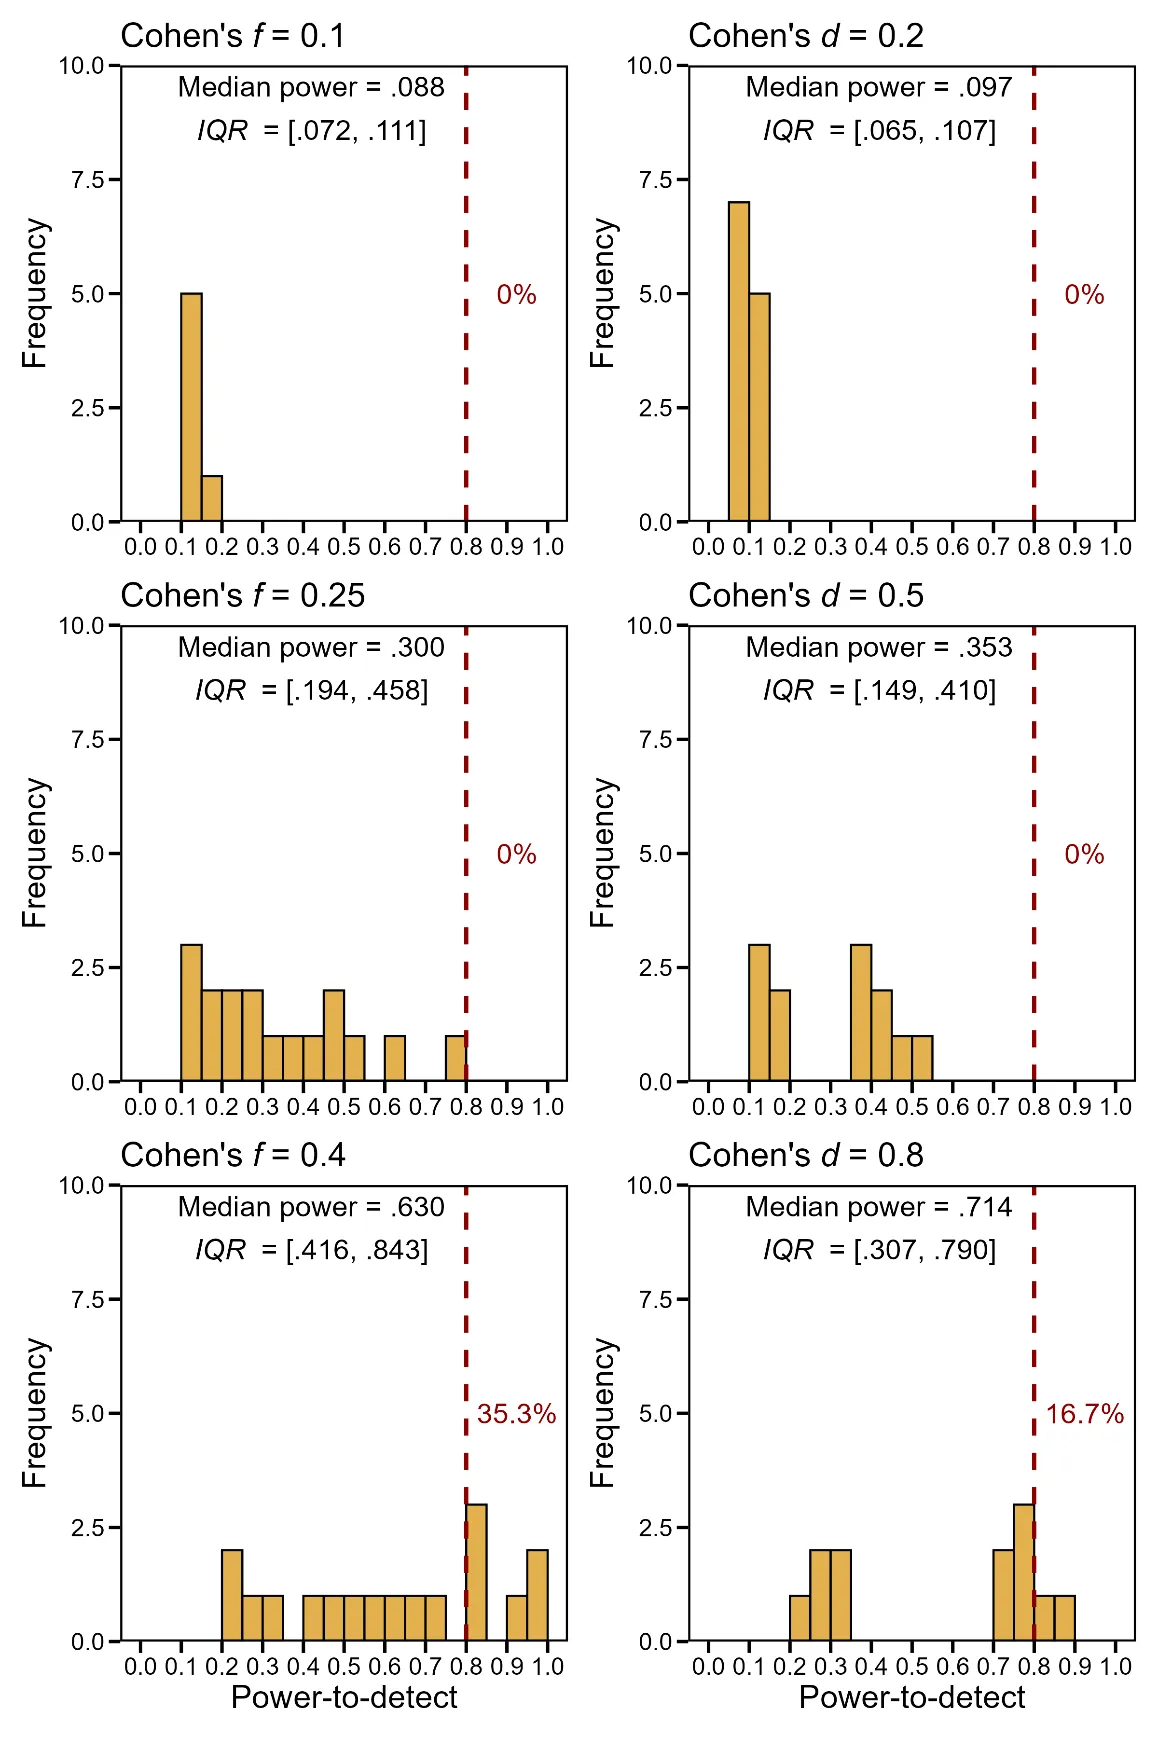
Distributions of statistical power to detect external small, medium, or large hypothetical effect sizes for the statistically non-significant tests. The left-hand panels correspond to F-tests (n = 17), and the right-hand panels to t-tests (n = 12). Each panel shows the distribution of power estimates for detecting one of the external conventional effect sizes, Cohen’s f = 0.1, 0.25, 0.4 for F-tests, and Cohen’s d = 0.2, 0.5, 0.8 for t-tests, based on the original sample size reported in the analyzed articles. The median power and interquartile range (IQR) are reported within each panel. The vertical dashed line marks the conventional threshold of 0.80 for adequate statistical power. Percentages represent the proportion of tests with power-to-detect ≥ 0.8.
These six patterns of points are characterized by negative slopes and are supported by statistically significant non-parametric correlations. For the F-tests, the Spearman’s correlations are s = –.414, –.424, and –.431 for the small, medium, and large hypothetical effect sizes (f = 0.1, 0.25, and 0.4), with corresponding 95% CIs of [–.612, –.183], [–.618, –.198], and [–.623, –.202] (p = .0002997, .0002048, and .0001556). For the t-tests, the respective Spearman’s correlations are –.585, –.592, and –.592 for the small, medium, and large effect sizes (d = 0.2, 0.5, and 0.8), with 95% CIs of [–.774, –.298], [–.776, –.299], and [–.784, –.307] (p = .001069, .0008958, and .0008958). Across the six analyses, the correlations reveal a moderate yet consistent monotonic association between the variables. Statistical significance appears strong despite the modest, though not small, sample size, pointing to a clear overall trend while leaving substantial variability unexplained.
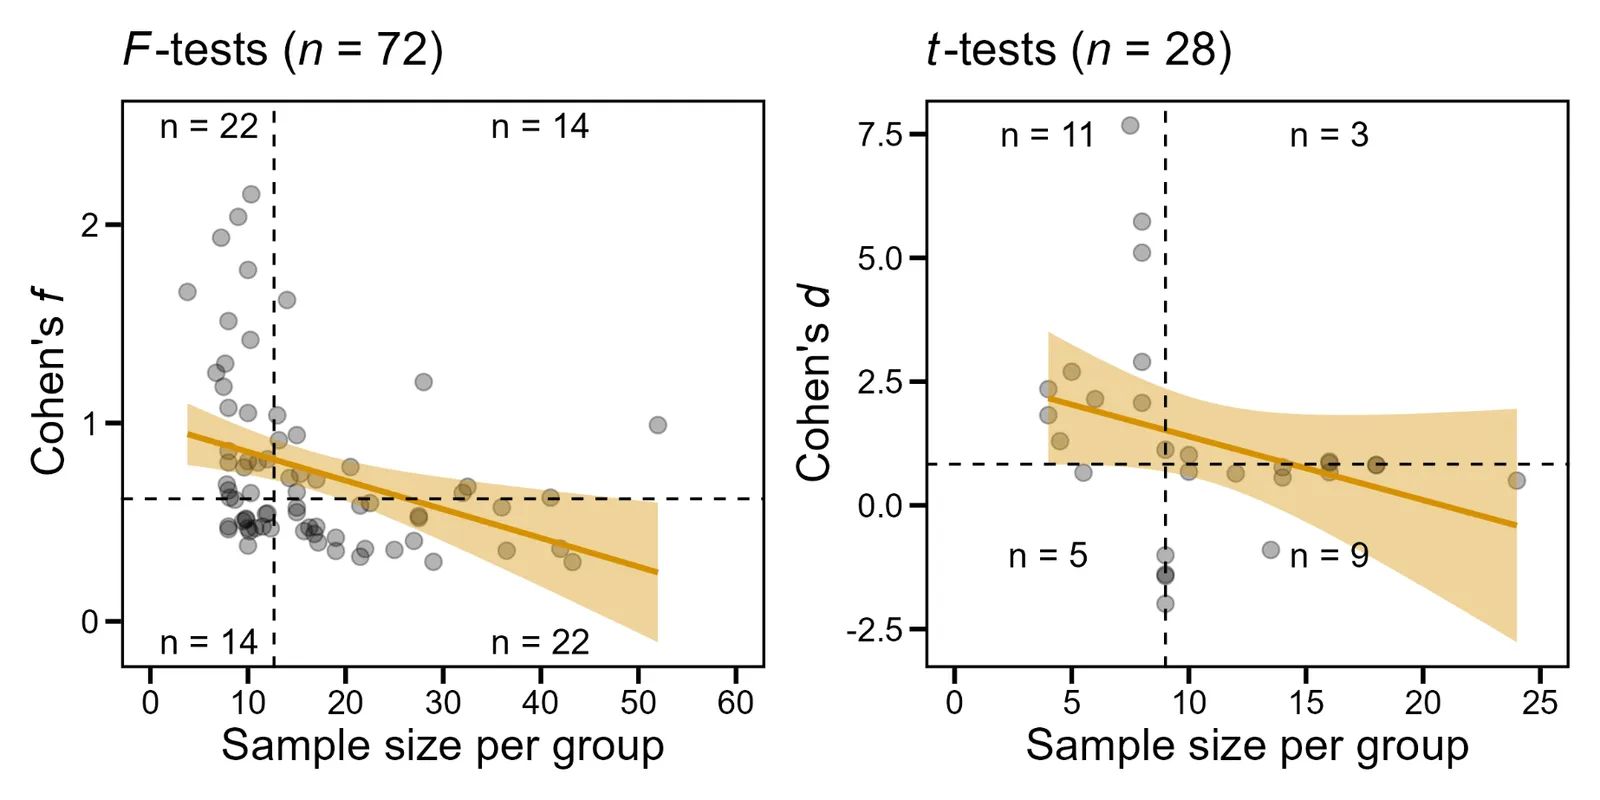
Relationship between sample size per group and observed effect size (Cohen's f or Cohen's d) for the statistically significant F-tests and t-tests. In each panel, the vertical dashed line marks the median sample size per group, and the horizontal dashed line marks the median effect size. These lines divide the panel into four quadrants, inserted primarily for clarity and presentation purposes (see text), with the number of tests indicated in each quadrant. The solid line depicts a simple regression fit to illustrate the general trend in the data. For two t-tests, the calculation of Cohen's d was not possible.
Relationship Between Observed Effect Sizes and Sample Sizes per Group
In statistically significant F-tests with effect sizes above the total median (Figure 5 left-hand graph, horizontal dashed line, median Cohen’s f = 0.531, IQR = [0.365, 0.800]), 25 are associated with sample sizes smaller than the total median sample size, and 20 are associated with sample sizes equal to or greater than the total median sample size (vertical dashed line, median sample size per group = 12.5, IQR = [9.8, 21.5]). While the 25 small-sample effect sizes include the 10 largest of all effects, most of the 20 effect sizes with samples at or above the median cluster close to the median effect size. The few effect sizes associated with the largest sample sizes per group are below or close to the median. The relationship between the sample size per group and effect size (Cohen’s d) of statistically significant t-tests (right-hand graph, Figure 5) is less striking than that found for the F-tests. The 10 largest effect sizes corresponded to smaller sample sizes per group, strictly below the median (vertical dashed line, median sample size per group = 9, IQR = [7.875; 14]). Most of the effect sizes associated with the largest sample sizes (above the median) are below or close to the median of the effect sizes (median Cohen’s d = 0.667, IQR = [0.331, 1.166]). A downward-sloping linear regression line highlights these patterns, which are also supported by statistically significant negative Spearman’s correlations (for F-tests: s = –.464, 95% CI [–.644, –.244], p = .00004094; for t-tests: s = –.521, 95%
emphCI [–.705, –.184], p = .004511). Here too, the correlations point to moderate, directionally stable links between the variables.
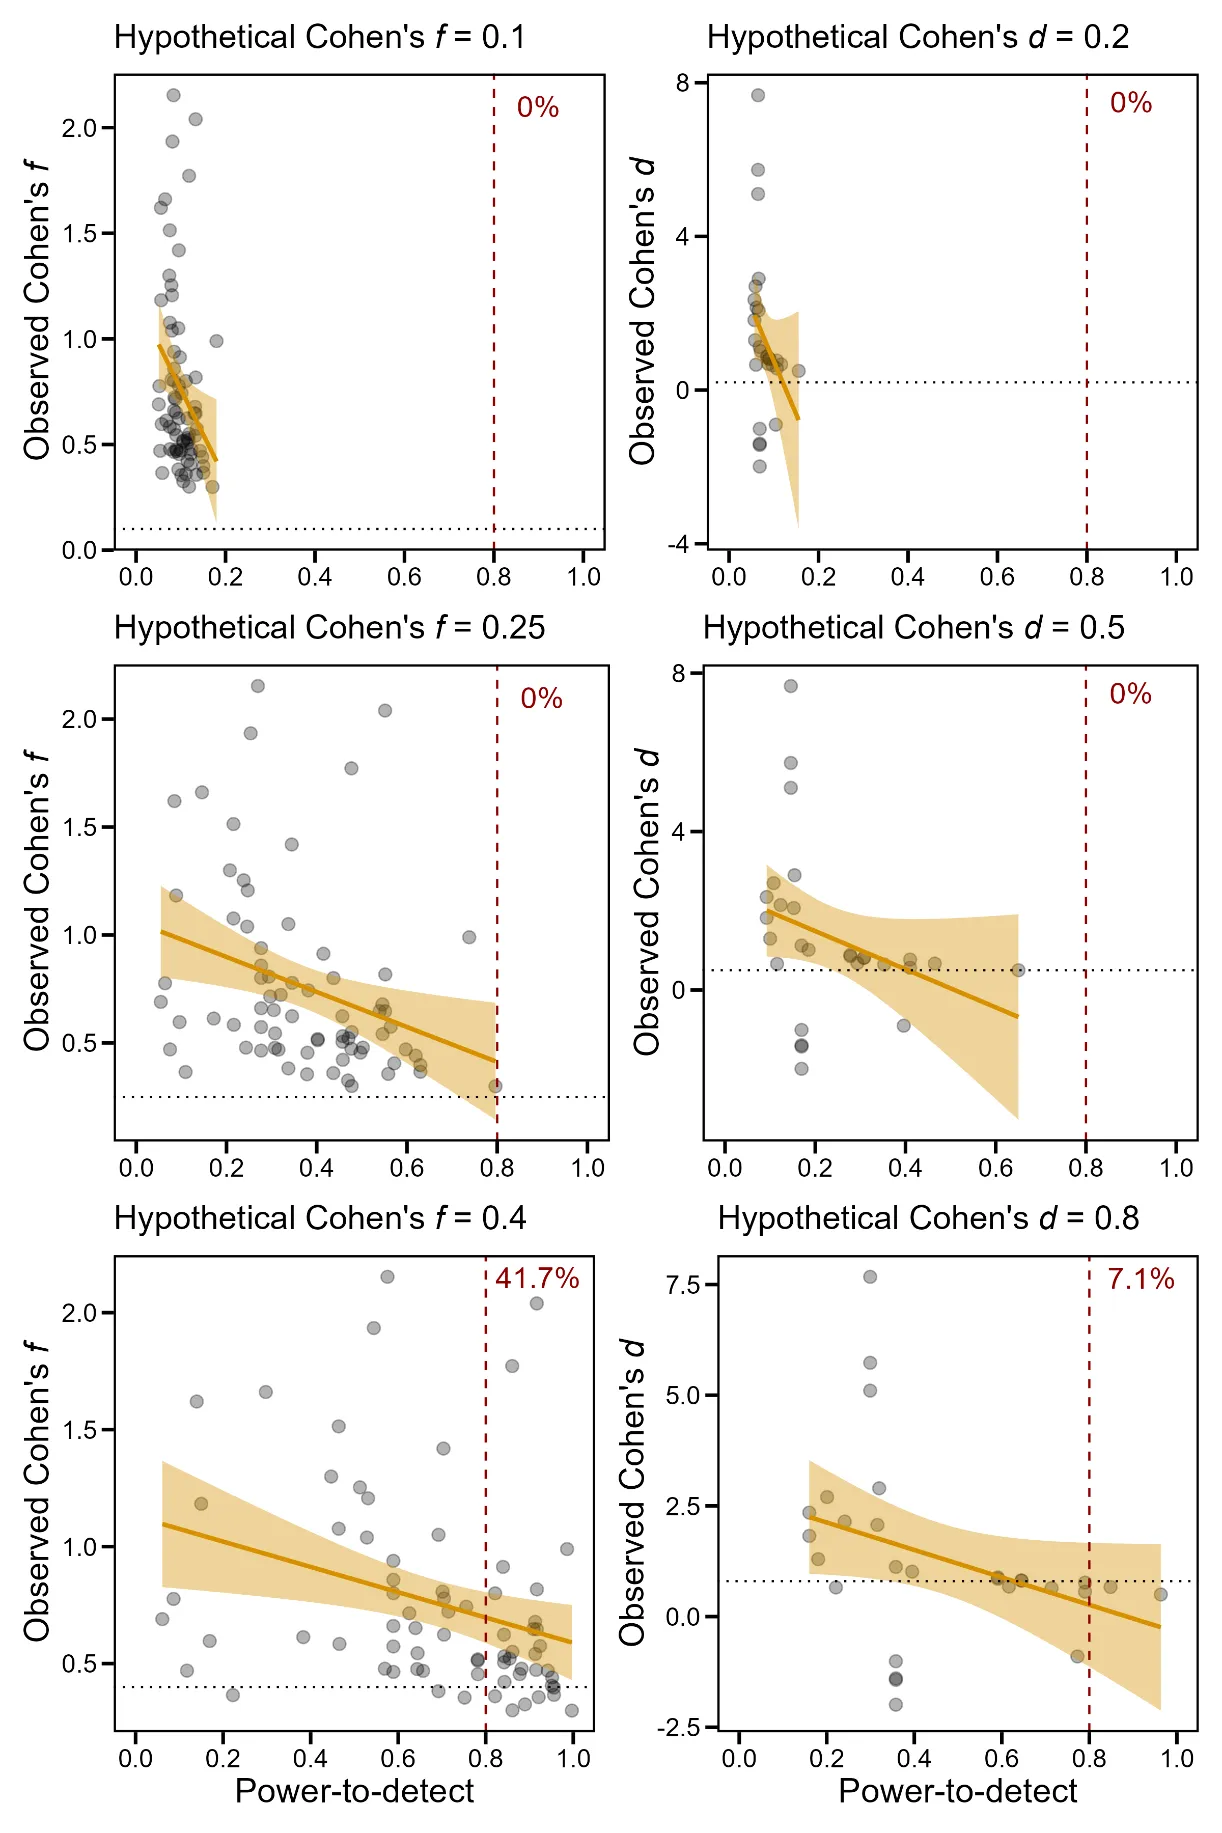
Relationship between statistical power (power-to-detect) and observed effect sizes for the statistically significant F-tests and t-tests. Powers were calculated under three hypothetical effect sizes corresponding to Cohen's f or d benchmarks (small, medium, large; top to bottom). Each point is an individual test. The solid line in each panel shows a simple regression fit illustrating the overall trend. The vertical dashed line marks the conventional power threshold of 0.80; the horizontal dotted line marks the hypothetical effect size. Percentages represent the proportion of tests with power-to-detect ≥ 0.8.
Positive Predicted Value (PPV) and False Discovery Rate (FDR)
In the top left-hand graph in Figure 6, the PPV curves dealing with the statistically significant F-tests increase with the H1 pre-study probability for each of the three Cohen’s f and the corresponding median statistical powers. The three PPV are smaller at the lower H1 pre-study probabilities, and they are greater at the higher median statistical powers (see for example p(H1) = .1, p(H1) = .5, and p(H1) = .75). More precisely, as regards the smallest effect size (f = 0.1; power = .096), with an H1 pre-study probability of .5 the PPV is .657. At the larger effect sizes (f = 0.25; f = 0.4) and statistical powers (.345; .710), the PPV are .873 and .934. All PPV are smaller at the H1 pre-study probability of .1 (.175; .434; and .612 for the three effect sizes).In the top right-hand graph of Figure 6, the FDR curves concerning the F-tests decrease continuously with the H1 pre-study probability. Hence, for the smallest effect size (f = 0.1; power = .096), with an H1 pre-study probability of .5, the FDR is .343. At the larger effect sizes (f = 0.25; f = 0.4) and statistical powers (.345; .710), the FDR are .126 and .066. The FDR are much higher at the H1 pre-study probability of .1 (.824; .566; and .388).The bottom left-hand graph of Figure 6 presents the PPV curves for statistically significant t-tests (Cohen’s d effect sizes). The patterns of results are similar to those found for the F-tests but with lower values: For the smallest effect size (d = 0.2; power = .068), the PPV is 0.578 at an H1 pre-study probability of .5. At larger effect sizes (d = 0.5; d = 0.8) and corresponding statistical powers (.170; .358), the PPV are .772 and .887. For small (d = 0.2), medium (d = 0.5), and large (d = 0.8) effect sizes, respectively, the PPV are .132, .274, and .443 at the H1 pre-study probability of.1.The bottom right-hand graph of Figure 6 depicts the FDR curves for the t-tests. For the smallest effect size (d = 0.2; power = .068), at an H1 pre-study probability of .5, the FDR is .422. At larger effect sizes (d = 0.5; d = 0.8) and related statistical powers (.170; .358), the FDR are .228 and .123. The FDR are much higher at the low H1 pre-study probability of .1 (.868; .726; and .557).
Discussion
What do the Results of the Present Study Mean?
The main finding of this study is a general lack of statistical power in the CPP literature on nicotine in mice, as none of the median powers for either significant or non-significant tests reaches the conventional .80 threshold. The highest median powers are observed for the largest hypothetical effect size (used to calculate individual powers) in significant F-tests (.71) and non-significant t-tests (.714), with all others clearly lower. For small and medium hypothetical effect sizes, no individual power reaches .80. Even for the largest effect size, only 41.7% and 35.3% of significant or non-significant F-tests, and 7.1% and 16.7% of t-tests, meet or exceed this level. Statistical power has not clearly improved over publication years.
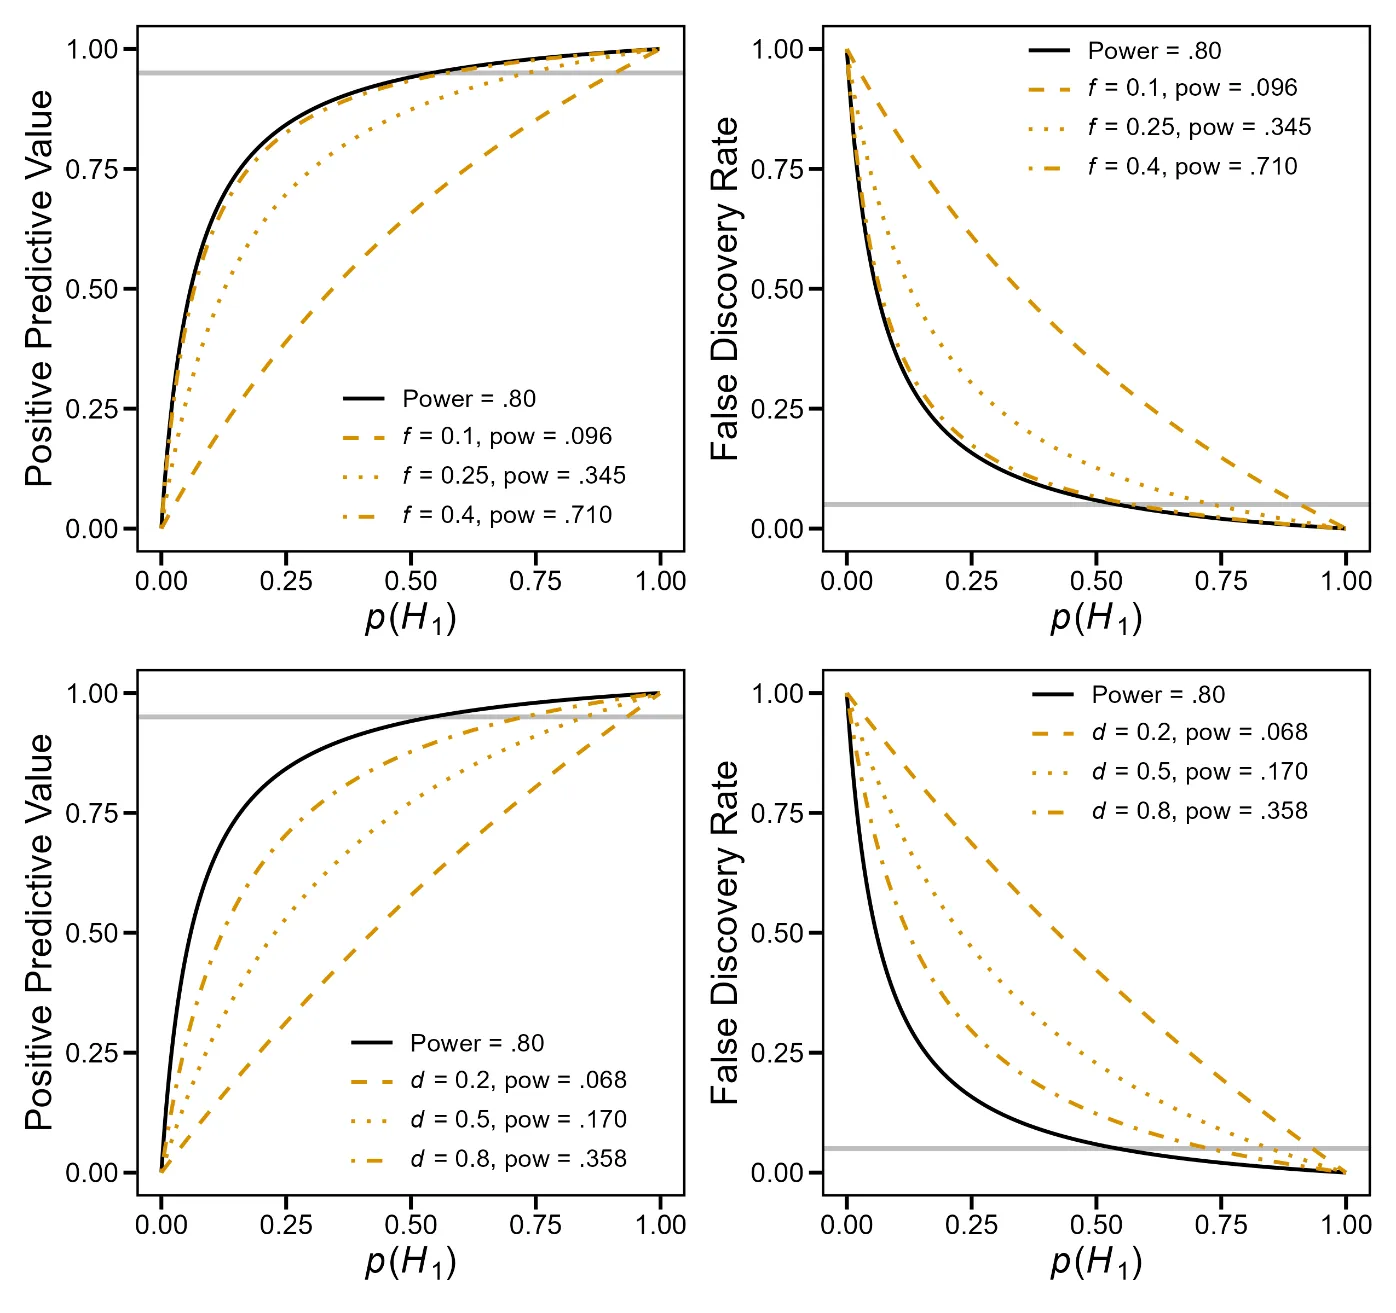
Relationship between the pre-study probability of H
Our results are not surprising as they are compatible with similar findings across several fields, especially in the domains related to neuro-behavioral sciences or involving laboratory or wild animals (Bonapersona et al., 2021; Button et al., 2013; Carneiro et al., 2018; Clayson et al., 2019; Cleasby et al., 2021; Giuffrida, 2014; Jennions & Moller, 2003; Mitra et al., 2019; Quintana, 2020; Smith et al. 2011; Szucs & Ioannidis, 2017; Vesterinen et al., 2010; Walum et al., 2016). Focusing on studies involving animals, the median or mean recalculated statistical power to detect a medium external or meta-analytic effect size typically ranges from approximately .15 to .65 across different tests, and is consistently below .70 (Button et al., 2013; Carneiro et al., 2018; Giuffrida, 2014; Jennions & Møller, 2003; Schmidt-Pogoda et al., 2019; Smith et al., 2011; Vesterinen et al., 2010). Here, the median statistical power to detect a medium effect size is only .345 for F-tests and .170 for t-tests. To put this into perspective, given the median sample size per group observed in our t-tests (n = 9) and assuming a conventional alpha level of .05 with a target power of .80, most nicotine CPP studies would be able to detect only a very large effect (d = 1.41, two-sided two-sample t-test), according to the Sawilowsky classification, which updates Cohen’s benchmarks (Sawilowsky, 2009). By contrast, detecting a medium effect (d = 0.5) under the same conditions would require at least 64 observations per group, more than seven times the typical sample size. In other words, if the true effect size of nicotine CPP in mice were smaller than this very large value, or smaller than most of the effect sizes observed in the studies analyzed here both tests, which is likely, the statistical power available in these studies would be insufficient to reliably detect the true effect size. Consequently, many non-significant findings in underpowered nicotine CPP studies, such as those failing to report a convincing nicotine CPP in some mouse strains (while others exhibit it), are likely false negatives, as small sample sizes set a detection threshold well above plausible effect sizes.
Another important aspect of the present findings, consistent with previous work, is the overall negative relationship between statistically significant effect sizes (Cohen’s f or Cohen’s d) and statistical power or individual sample sizes per group. These patterns align closely with results frequently reported in surveys of published research, sometimes encompassing thousands of tests, across diverse fields such as neuroimaging and neuroscience more generally (Button et al., 2013; David et al., 2013; Dumas-Mallet et al., 2017; Szucs & Ioannidis, 2017; Yarkoni, 2009), sports medicine (Ekkenakis et al., 2023), speech-language pathology (Gaeta & Brydges, 2020), ecology and evolutionary biology (Cleasby et al., 2021; Yang et al., 2023), psychology and cognition-related domains (Button et al., 2013; Kühberger et al., 2014; Szucs & Ioannidis, 2017), and laboratory animal research (Button et al., 2013; Vesterinen et al., 2010). In Button et al. (2013), for example, it was estimated that the corresponding effect sizes were inflated approximately by 25% and 50% using a meta-analytic effect size to derive statistical powers and to calculate the inflation, with low statistical powers ranging from 0.08 to 0.31 found in several neuroscientific fields. Note that this quantitative estimation of the extent of effect size inflation was not possible in the present study, as no meta-analysis is available in the field that provides a synthetic effect size intended to estimate the underlying population effect size (we relied on external conventional effect sizes). In other words, many underpowered CPP nicotine studies may have reported an overestimated amplitude of the conditioned preference induced by this drug. Hence, the true nicotine CPP, which is unknown, could be much smaller than the average response documented in the literature so that any of its interpretation in terms of unambiguous rewarding processes should be taken cautiously.
It is important to emphasize that the effect sizes analyzed in the present study refer specifically to the magnitude of the direct expression of nicotine CPP, that is, the preference for nicotine observed in the absence of any experimental manipulation. In the literature, this direct expression is used in two main ways. In some experiments, it serves as a positive control to establish a nicotine-induced preference against which the effect of an experimental manipulation (e.g., a pharmacological agent or a targeted genetic intervention) can be tested. In others, it is directly compared across conditions such as mouse strains to evaluate inherent differences in nicotine responsiveness, typically without introducing additional manipulations. These effect sizes therefore do not capture the influence of independent variables themselves, but rather the reliability of the direct expression of nicotine CPP. This distinction is critical: If the detection of this effect is underpowered, the expression of nicotine CPP may not be reliably established. In such cases, statistically significant differences alone are insufficient, and the interpretability of any observed effects involving independent variables is jeopardized.
Low statistical power can only attenuate PPV and, correspondingly, accentuate FDR, especially at low or relatively low pre-study probabilities of H1 (smaller than .50). In our case, this clearly appears for the two lowest median statistical powers derived from the low and medium effect sizes of both F- and t-tests. It is less marked for the highest median powers (and effect sizes), in particular for the F-tests whose median statistical power (.705) is slightly below the conventional threshold of .80. When the pre-study probability of H1 exceeds .50, which can reasonably be considered more than modest, the three median powers for the F-tests yield PPVs above .95 and FDRs below .05. For the t-tests, this level was reached only when the pre-study probability approached .70. Again, our results substantially agree with the meta-scientific literature analyzing large sets of studies with underpowered tests in preclinical animal research (Schmidt-Pogoda et al., 2019), experimental psychology (Lodder et al., 2019; Szucs & Ioannidis, 2017), and human neurobehavioral fields (Baldwin, 2017; Button et al., 2013; Szucs & Ioannidis, 2017; Walum et al., 2016). Note that in some of these studies, the calculation of PPV and FDR was weighted by a bias representing methodological and reporting questionable research practices that favor the publication of positive results (Baldwin et al., 2017; Ioannidis, 2005; Szucs & Ioannidis, 2017). The bias further curbs the PPV and accentuates the FDR. For example, in a study analyzing 3,801 cognitive neuroscience and psychology studies, the incorporation of such a bias yielded a low FDR of .135 at a H1 pre-study probability of .50 without bias. With the incorporation of a bias of .10, the FDR jumped at .23 (Szucs & Ioannidis, 2017). This suggests that if we had incorporated biases into our calculations, the posterior probabilities of true or false effects would have been even lower (PPV) or higher (FDR). However, it seems to us that the values reported here without considering any bias are sufficiently meaningful.
Insofar as there is no doubt that nicotine possesses rewarding properties in general, the pre-study probability or plausibility of obtaining an unambiguous nicotine CPP should be quite high, even at a statistical power greatly below 0.8. Therefore, one could question whether it is appropriate to investigate the relationship between the pre-study probability of CPP results and the PPV or FDR in this case. In fact, the CPP procedure is known to have numerous limitations that warrant consideration of modest and diverse pre-study or plausibility values in the PPV and FDR analysis. In particular, CPP is highly influenceable by various confounding variables such as stress, anxiety, and sensitivity to environmental and contextual variations. Some strains or genotypes may be highly vulnerable to these factors rather than to the addictive properties of the drug supposed to be objectified with the CPP procedure. Also, this procedure is cumbersome for providing the graded dose-effect curves needed to answer some psychopharmacological questions. These limitations, among others, likely explain why CPP results can sometimes be challenging to replicate across different laboratories on their own (for an example see Bardo et al., 2015). In addition, a large portion of the studies analyzed here were genetic in nature, seeking to assess whether specific genetic modifications or mouse strains could influence the establishment of nicotine-induced preference. Many of these studies did so for the first time and in the absence of strong, unambiguous, and precise prior knowledge regarding the causal role of the genetic factors under investigation, despite the availability of several theoretical accounts proposing learning-related, motivational, and neurobiological explanations of CPP. This also precludes any assumption of high CPP plausibility in these cases.
What Conceptual and Practical Steps can Improve Power in Nicotine CPP Research?
The absence of detailed and complete sample size justifications or power analyses in the CPP studies analyzed here suggests that researchers do not consider a smallest between-group difference or within-group change from baseline that would plausibly reflect the expression of an unambiguous CPP. Such a criterion, sometimes referred to as the Smallest Effect Size of Interest (SESOI; Lakens, 2022), is essential for specifying an appropriate hypothetical effect size in sample size planning through power analysis. It is indeed possible, if not recommended, to adopt it directly for that purpose (see below in this discussion). In biological and animal-based research, it is often called the Minimum Biologically Important Difference (MBID; Reynolds, 2024) or the effect size of biological interest (Festing et al., 2004; Huang et al., 2019). In clinical contexts, it is referred to as the Minimum Clinically Important Difference (MCID; Copay et al., 2007; Man-Son-Hing et al., 2002).
Importantly, observed effect sizes that fall below the SESOI (or an equivalent threshold), or whose confidence intervals lie entirely below it, should be interpreted with caution or considered scientifically uninformative, regardless of statistical significance, which is not a meaningful indicator of an effect’s importance or relevance (Cook et al., 2014; Cumming, 2014; Man-Son-Hing et al., 2002; Reynolds, 2024; Robey, 2004). Note that, while power analysis requires hypothetical effect sizes expressed in standardized units, SESOIs may be expressed either in raw terms (e.g., difference in means) or in standardized terms (e.g., Cohen’s d), with raw units often offering more direct interpretability in specific experimental contexts.
To identify a SESOI that plausibly marks CPP formation, researchers in nicotine CPP may draw on five main, and potentially complementary, strategies: (1) structured expert consensus, (2) analysis of archival data from single or multiple laboratories (data-sharing), (3) analysis of multi-laboratory preliminary data generated within a research collaboration, (4) empirical derivation from a CPP scoring heuristics, and (5) meta-analytic synthesis. These approaches anchor the definition of a SESOI in observed behavior, and SESOIs should ideally be supported by converging evidence to capture thresholds that are both meaningful and reproducible.
The first strategy, structured expert consensus, relies on consultation methods such as expert panels (e.g., professional surveys) or Delphi procedures. These methods, which typically aim to generate consensus are widely used in the health sciences, for example, to develop clinical guidelines or set research priorities. Although panel-based approaches have been employed to define minimum clinically important differences (MCIDs) for sample size planning (see Cook et al., 2014), the use of Delphi methods for this purpose remains curiously rare (e.g., Henderson et al., 2019; Klukowska et al., 2024). To our knowledge, such applications are virtually absent in experimental and preclinical psychopharmacology. However, there is no tangible reason why they could not be applied in the nicotine CPP field.
The second strategy, analyzing data from the archives of single or multiple laboratories or from multi-laboratory collaborations, is probably the most familiar of the five strategies, although only a minority of researchers actually uses it. These approaches provide access to existing datasets, whether historical or from preliminary studies, that can inform a SESOI definition through empirical distributions of effect sizes and variability. Such evidence can help anchor plausible thresholds within a broader behavioral context, while multi-laboratory collaborations further improve generalizability and reduce single-study idiosyncratic biases (Ioannidis, 2014; Lakens, 2022; Munafò et al., 2017; Open Science Collaboration, 2015).
It is also possible to empirically derive a SESOI from CPP scoring heuristics. For example, in a recent proposal for a new scoring method, Yates (2023) suggested classifying individual animals as exhibiting CPP or not, based on tolerance intervals derived from the distribution of control-group scores (e.g., covering 95% of values with 90% confidence). Animals whose scores exceed the upper bound would then be considered to exhibit a meaningful CPP. Building on this idea, we propose computing the mean and standard deviation of the subset of animals classified as showing CPP, and deriving a Cohen’s d that reflects the average magnitude of CPP. This value could serve as an empirically grounded SESOI, tied to what can be distinguished from variability under controlled conditions. To reduce the risk of inflated or unstable thresholds due to small or noisy samples, this strategy should be applied to large, methodologically homogeneous datasets, ideally pooled across studies, laboratories, or archival controls. As an initial step, it could be anchored in data obtained with the most commonly employed combination of strain, apparatus and procedure, number of conditioning trials, and dose in nicotine CPP studies, thereby ensuring direct relevance to standard experimental conditions.
One must admit that the choice of tolerance interval parameters (e.g., 95% coverage with 90% confidence), while reasonable, lacks an explicit justification regarding what should count as a meaningful CPP. Nevertheless, it offers an empirically grounded and transparent criterion, one that can, in principle, be refined through expert elicitation or comparative data across studies. Additionally, if the distribution of CPP scores among animals exceeding the threshold is skewed or contains outliers, a trimmed mean could be used instead of the arithmetic mean to yield a more robust estimate of central tendency. In such cases, a robust version of Cohen’s d, based on trimmed means and winsorized variances, can be computed. Although such a robust estimate is not directly comparable to the conventional d, it can still inform the specification of a SESOI if the chosen estimation approach aligns with the planned analysis strategy in subsequent studies.
Finally, another potentially useful source for defining a SESOI is meta-analytic effect sizes from adjacent domains involving tasks partially related to CPP. Since no meta-analysis currently addresses nicotine- or drug-induced CPP, evidence from associative-spatial learning paradigms, such as fear conditioning or spatial memory tasks, may provide plausible lower-bound anchors for provisional SESOIs.
For the sake of argument, the following meta-analyses could be employed as examples. Carneiro et al. (2018) reported a mean effect size of Hedges’ g = 1.4 in fear conditioning studies (memory-enhancing) in rats and mice. Bonapersona et al. (2019) found |g| = 0.59 for non-stressful learning tasks and |g| = 0.28 for stressful tasks in male rodents. Lymer et al. (2024) reported d-values of 0.42 and 0.54 for two measures of spatial memory (Morris water maze) modulated by various estrogenic molecules. Jonasson (2005) reported sex differences in two spatial tasks, with d = 0.49 (Morris water maze) and 0.67 (radial maze) in rats, and smaller, more variable effects in mice. Based on these precedents, one may illustratively suggest that a Cohen’s d of approximately 0.30 could serve as a reasonable lower bound for a provisional SESOI in nicotine CPP. This positioning is conceptually consistent with the notion of a SESOI as a minimum threshold: By definition, a SESOI should represent the smallest effect size worth detecting and interpreting, reflecting a change of unambiguous neurobehavioral or theoretical relevance.
To pursue the exercise, one could also draw on the synthesis by Bardo et al. (1995), a unique contribution that, in a way, touches on effect magnitudes in this field. This work offers an overview of point-biserial r-correlations between CPP effect amplitudes and the corresponding doses (several) of four addictive drugs. Although these r-values reflect dose-effect associations rather than between-group contrasts (and the article is not a formal meta-analysis despite its title), they can still serve as a tentative behavioral benchmark for the typical magnitude of CPP-related effects. The reported values ranged from r = 0.17 to over r = 0.70, regardless of statistical significance. Although these results do not derive from nicotine studies and mainly concern rats, they suggest a broad frame within which drug-induced CPP effects typically fall. Within this frame, a SESOI around r = 0.20–0.25 (≈ d = 0.40) could be considered, as it lies near the lower end of the observed range.
Ideally, once a SESOI has been established and conceptually accepted, researchers should align the hypothetical effect size used for sample size planning with this SESOI, preferably by using it (or its equivalent) directly (Huang et al., 2019; Kraemer & Kupfer, 2006; Lakens, 2022). This approach ensures that the study is adequately powered to detect the smallest effect considered scientifically meaningful and enhances the interpretability of findings. Returning to our results, none of the studies considered here that reported a t-test had a sample size sufficient to detect the two illustrative SESOI values (used as hypothetical effect sizes) suggested in the previous exploratory exercises (d = 0.30 and d = 0.40) with 0.80 power at = 0.05. Detecting d = 0.30 would require 176 observations per group, and detecting d = 0.40 would require 100 observations per group, compared to a median of only n = 9 per group in the t-tests analyzed here, a striking gap.
However, nicotine CPP researchers may not yet be in a position to define a SESOI. In such cases, a pragmatic alternative is to identify a hypothetical effect size that seems plausible under the conditions of the planned study. Several of the same sources used to inform a SESOI can be drawn upon to formulate a hypothetical effect size, such as expert judgment, meta-analytic estimates from adjacent paradigms, or pooled archival data from CPP experiments conducted with consistent methods either within or across laboratories. In this context, these sources serve to approximate an expected effect size, not to establish an interpretability threshold, a distinction that should be kept in mind.
Crucially, regardless of the strategy employed to identify a SESOI or a hypothetical effect size, researchers should remain mindful of the well-documented inflation of effect size estimates in low-powered research across many fields, a pattern also evident in the nicotine CPP studies analyzed here. As a general safeguard, it is advisable to apply a downward adjustment to any planned effect size, in order to temper overly optimistic assumptions and reduce the risk of underpowered study designs (i.e., when the true effect is smaller than the hypothetical one). One simple, albeit somewhat arbitrary, recommendation is to divide the original estimate by two (Gelman & Carlin, 2014). Alternatively, the lower bound of a confidence interval from a meta-analytic effect size, or from any other valid estimate, can also serve this purpose (Anderson et al., 2017; Perugini et al., 2014). Another strategy is to adopt the 20th to 25th percentile from the effect size distribution reported in a meta-analysis (Boedeker et al., 2024; Perugini et al., 2014). In our case, although the above-mentioned meta-analyses are only tangentially related to nicotine CPP, they might still be suitable for this purpose. By analogy, one may select the effect size corresponding to the 25th percentile of the distributions observed in the present review. For instance, for the t-tests, this would yield a hypothetical effect size of d = 0.33 (first quartile value), given a median observed effect size of d = 0.67. These heuristics should not be mistaken for empirically justified estimates. Rather, they serve as conservative placeholders particularly valuable when precise planning values are lacking.
In some fields, researchers adopt a hypothetical effect size by uncritically defaulting to conventional benchmarks, such as d = 0.5, the “medium” effect size for mean differences proposed by Cohen (1988), a practice criticized for its lack of scientific grounding (Cook et al., 2018; Correll et al., 2020). Such uncritical adoption canalizes both sample size determination and effect interpretation, increasing the risk of systematically overlooking smaller yet scientifically meaningful effects (Lakens, 2022; Lenth, 2001; Schäfer & Schwarz, 2019). When carried forward into subsequent studies, it can render sample size calculations substantively hollow. If such conventional values are used at all, they should be treated explicitly as provisional, subject to revision as theoretical understanding or new empirical evidence accumulates. The risk of canalization is not limited to conventional benchmarks: It also applies to any placeholder effect size adopted without scientific justification.
With a hypothetical effect size (and possibly a SESOI) in hand, a single laboratory may be unable to recruit large samples required for adequate power, as could be the case for the 100 or 176 mice per group estimated above to detect the two SESOI-derived hypothetical values. A commonly proposed solution is to join multi-laboratory efforts, either by prospectively coordinating studies to secure sufficient power while modelling between-site variation, or by pooling existing data (e.g., historical controls) to increase effective sample sizes (Bonapersona et al., 2021; Ioannidis, 2014; Reynolds, 2024; Voelkl et al., 2018). However, these collaborations are probably not always feasible, particularly for laboratories working in less common research areas. Large sample sizes can be impractical not only for individual laboratories but also, in some cases, for multi-site efforts when studies involve costly genetically modified animal lines or expensive pharmacological agents, as is often the case in CPP research, and more generally in animal-based psychopharmacology. Yet, in such circumstances, a confirmatory study with limited power but conducted with strong methodological rigor can still yield informative, directional insights (Carnahan & Brown, 2024; Hackshaw, 2008; Lakens, 2022). In these situations, researchers are advised to perform a sensitivity power analysis to determine the smallest effect size that can be reliably detected given the available sample size. A comparison of this value with the effect size required to identify a meaningful CPP (as defined by the SESOI or the hypothetical effect size) should form the core of a transparent discussion of the study’s evidential scope.
In many designs with more than one independent variable (e.g., mixed ANOVAs), the concept of a SESOI or hypothetical effect size may concern not only a simple difference between two means (e.g., Cohen’s d), but also structured patterns of differences. For instance, a hypothesized mean difference such as the CPP effect of nicotine may be embedded within an interaction term when the research question addresses whether a manipulation (e.g., a neuropharmacological intervention) modulates this primary effect. In such situations, study planning should consider the expected magnitude of the interaction, typically by specifying a hypothetical effect size in terms of Cohen’s f (or partial eta-squared, or any related metric), rather than relying only on simple group contrasts. This consideration becomes particularly relevant when evaluating whether an intervention alters the direct expression of nicotine CPP. Once a SESOI has been defined for the nicotine CPP effect itself, it is necessary to determine the minimum effect size that would represent a meaningful modulation, such as an attenuation, of that effect. Here, the hypothesis is no longer a single mean contrast but rather a structured pattern of differences, usually reflected in a statistically significant ANOVA interaction. For practical guidance on specifying effect sizes in the context of ANOVA designs, including the use of simulations, see Zhang and Yuan (2018). More generally, the principles outlined earlier still apply: Researchers may simulate or construct plausible patterns of group means that embody the hypothesized interaction and then derive the corresponding effect size for sample size planning.
Conclusion
The aim of this study was to evaluate whether the nicotine CPP sub-field of experimental psychopharmacology suffers from (1) a lack of power, (2) overestimated effect sizes, and (3) a low true and high false discovery rates (PPV, FDR). We found that (1) statistical power is low even when the real effect sizes are “large” (in the Cohen classification terminology). This lack of power is accompanied by (2) inflated effect size estimates and (3) low levels of PPV and high levels of FDR. Taken together, our results suggest that many published findings on the direct expression of nicotine-induced CPP could be considerably overestimated, or perhaps attributable to chance, despite their appearance as well-established effects.
Part of the present discussion offers points for researchers in the field to consider when justifying both their sample sizes and their assumed effect sizes in study design. This is not only good practice but is also explicitly recommended by various bodies overseeing animal research, particularly ethical committees, as well as by international guidelines such as ARRIVE 2.0 (Percie du Sert et al., 2020). The ARRIVE guidelines now extend well beyond minimal reporting standards: by detailing study design considerations, sample size justification, and bias reduction strategies, they provide a level of methodological guidance that can effectively serve as a blueprint for conducting animal research, not merely reporting it. Our results add to the growing body of evidence underscoring the urgent and widely recognized need to improve methodological practices in other scientific domains and show that this concern also applies to the specific psychopharmacological literature on nicotine-induced CPP.
Conflict of interest
The authors declare that they have no conflicts of interest.
Funding
This research received no external funding. It was conducted mainly as the Master’s thesis of the first author, under the supervision of the second author.
Data Availability
The data supporting this research can be found on the OSF website (https://osf.io/nbksj/).
References
Altman, D. G. (1994). The scandal of poor medical research. The BMJ, 308(6924), 283–284. https://doi.org/10.1136/bmj.308.6924.283
Anderson, S. F., Kelley, K., & Maxwell, S. E. (2017). Sample-size planning for more accurate statistical power: A method adjusting sample effect sizes for publication bias and uncertainty. Psychological Science, 28(11), 1547–1562. https://doi.org/10.1177/0956797617723724
Baldwin, S. A. (2017). Improving the rigor of psychophysiology research. International Journal of Psychophysiology, 111, 5–16. https://doi.org/10.1016/j.ijpsycho.2016.04.006
Balk, E. M., Earley, A., Patel, K., Trikalinos, T. A., & Dahabreh, I. J. (2012). Empirical assessment of within-arm correlation imputation in trials of continuous outcomes (AHRQ Publication No. 12-EHC141-EF). Agency for healthcare research and quality. http://www.ncbi.nlm.nih.gov/books/NBK115797/
Bardo, M. T., Horton, D. B., & Yates, J. R. (2015). Chapter 7—Conditioned place preference as a preclinical model for screening pharmacotherapies for drug abuse. In C. G. Markgraf, T. J. Hudzik, & D. R. Compton (Eds.), Nonclinical assessment of abuse potential for new pharmaceuticals (pp. 151–196). Academic Press. https://doi.org/10.1016/B978-0-12-420172-9.00007-2
Bardo, M. T., Rowlett, J. K., & Harris, M. J. (1995). Conditioned place preference using opiate and stimulant drugs: A meta-analysis. Neuroscience & Biobehavioral Reviews, 19(1), 39-51. https://doi.org/10.1016/0149-7634(94)00021-R
Begley, C. G., & Ioannidis, J. P. A. (2015). Reproducibility in science: Improving the standard for basic and preclinical research. Circulation Research, 116(1), 116–126. https://doi.org/10.1161/CIRCRESAHA.114.303819
Bishop, D. (2019). Rein in the four horsemen of irreproducibility. Nature, 568(7753), 435–435. https://doi.org/10.1038/d41586-019-01307-2
Boedeker, P., Nelson, G., & Carter, H. (2024). So is it better than something else? Using the results of a random-effects meta-analysis to characterize the magnitude of an effect size as a percentile. Psychological Methods. https://doi.org/10.1037/met0000704
Bonapersona, V., Hoijtink, H., RELACS Consortium, Sarabdjitsingh, R. A., & Joëls, M. (2021). Increasing the statistical power of animal experiments with historical control data. Nature Neuroscience, 24, 470-477. https://doi.org/10.1038/s41593-020-00792-3
Bonapersona, V., Kentrop, J., van Lissa, C. J., van Der Veen, R., Joëls, M., & Sarabdjitsingh, R. A. (2019). The behavioral phenotype of early life adversity: A 3-level meta-analysis of rodent studies. Neuroscience & Biobehavioral Reviews, 102, 299–307. https://doi.org/10.1016/j.neubiorev.2019.04.021
Button, K. S., Ioannidis, J. P. A., Mokrysz, C., Nosek, B. A., Flint, J., Robinson, E. S. J., & Munafò, M. R. (2013). Power failure: Why small sample size undermines the reliability of neuroscience. Nature Reviews Neuroscience, 14(5), 365–376. https://doi.org/10.1038/nrn3475
Carnahan, R. M., & Brown, G. D. (2024). The power and pitfalls of underpowered studies. Pharmacotherapy: The Journal of Human Pharmacology and Drug Therapy, 44(9), 698–700. https://doi.org/10.1002/phar.4605
Carneiro, C. F. D., Moulin, T. C., Macleod, M. R., & Amaral, O. B. (2018). Effect size and statistical power in the rodent fear conditioning literature – A systematic review. PLOS One, 13(4), Article e0196258. https://doi.org/10.1371/journal.pone.0196258
Clayson, P. E., Carbine, K. A., Baldwin, S. A., & Larson, M. J. (2019). Methodological reporting behavior, sample sizes, and statistical power in studies of event-related potentials: Barriers to reproducibility and replicability. Psychophysiology, 56(11), Article e13437. https://doi.org/10.1111/psyp.13437
Cleasby, I. R., Morrissey, B. J., Bolton, M., Owen, E., Wilson, L., Wischnewski, S., & Nakagawa, S. (2021). What is our power to detect device effects in animal tracking studies? Methods in Ecology and Evolution, 12(7), 1174–1185. https://doi.org/10.1111/2041-210X.13598
Cohen, J. (1962). The statistical power of abnormal-social psychological research: A review. The Journal of Abnormal and Social Psychology, 65(3), 145–153. https://doi.org/10.1037/h0045186
Cohen, J. (1988). Statistical power analysis for the behavioral sciences (2nd ed.). Routledge Academic.
Cook, J. A., Hislop, J., Adewuyi, T. E., Harrild, K., Altman, D. G., Ramsay, C. R., Fraser, C., Buckley, B., Fayers, P., Harvey, I., Briggs, A. H., Norrie, J. D., Fergusson, D., Ford, I., & Vale, L. D. (2014). Assessing methods to specify the target difference for a randomised controlled trial—DELTA (Difference ELicitation in TriAls) review. Health Technology Assessment, 18(28), 1–175. https://doi.org/10.3310/hta18280
Copay, A. G., Subach, B. R., Glassman, S. D., Polly, D. W., & Schuler, T. C. (2007). Understanding the minimum clinically important difference: A review of concepts and methods. The Spine Journal, 7(5), 541–546. https://doi.org/10.1016/j.spinee.2007.01.008
Correll, J., Mellinger, C., McClelland, G. H., & Judd, C. M. (2020). Avoid Cohen’s ‘small’, ‘medium’, and ‘large’ for power analysis. Trends in Cognitive Sciences, 24(3), 200–207. https://doi.org/10.1016/j.tics.2019.12.009
Cumming, G. (2014). The new statistics: Why and how. Psychological Science, 25(1), 7–29. https://doi.org/10.1177/0956797613504966
Darling, H. S. (2024). Statistical errors in scientific research: A narrative review. Cancer Research, Statistics and Treatment, 7(2), 241–249. https://doi.org/10.4103/crst.crst_283_23
David, S. P., Ware, J. J., Chu, I. M., Loftus, P. D., Fusar-Poli, P., Radua, J., Munafò, M. R., & Ioannidis, J. P. A. (2013). Potential reporting bias in fMRI studies of the brain. PLOS One, 8(7), Article e70104. https://doi.org/10.1371/journal.pone.0070104
de Vries, Y. A., Schoevers, R. A., Higgins, J. P. T., Munafò, M. R., & Bastiaansen, J. A. (2023). Statistical power in clinical trials of interventions for mood, anxiety, and psychotic disorders. Psychological Medicine, 53(10), 4499–4506. https://doi.org/10.1017/S0033291722001362
Dumas-Mallet, E., Button, K. S., Boraud, T., Gonon, F., & Munafò, M. R. (2017). Low statistical power in biomedical science: A review of three human research domains. Royal Society Open Science, 4(2), Article 160254. https://doi.org/10.1098/rsos.160254
Etz, A., & Vandekerckhove, J. (2016). A Bayesian perspective on the reproducibility project: Psychology. PLOS One, 11(2), Article e0149794. https://doi.org/10.1371/journal.pone.0149794
Ekkekakis, P., Swinton, P., & Tiller, N. B. (2023). Extraordinary claims in the literature on high-intensity interval training (HIIT): I. Bonafide scientific revolution or a looming crisis of replication and credibility? Sports Medicine, 53(10), 1865–1890. https://doi.org/10.1007/s40279-023-01880-7
Errington, T. M., Mathur, M., Soderberg, C. K., Denis, A., Perfito, N., Iorns, E., & Nosek, B. A. (2021). Investigating the replicability of preclinical cancer biology. eLife, 10, Article e71601. https://doi.org/10.7554/eLife.71601
Festing, M. F. W., Overend, P., Gaines Das, R., Cortina Borja, M., & Berdoy, M. (2002). The design of animal experiments: Reducing the use of animals in research through better experimental design. The Royal Society of Medicine Press for Laboratory Animals.
Fraley, R. C., Chong, J. Y., Baacke, K. A., Greco, A. J., Guan, H., & Vazire, S. (2022). Journal N-Pact Factors from 2011 to 2019: Evaluating the quality of social/personality journals with respect to sample size and statistical power. Advances in Methods and Practices in Psychological Science, 5(4), Article 25152459221120217. https://doi.org/10.1177/25152459221120217
Fraley, R. C., & Vazire, S. (2014). The N-Pact factor: Evaluating the quality of empirical journals with respect to sample size and statistical power. PLOS One, 9(10), Article e109019. https://doi.org/10.1371/journal.pone.0109019
Gaeta, L., & Brydges, C. R. (2020). An examination of effect sizes and statistical power in speech, language, and hearing research. Journal of Speech, Language & Hearing Research, 63(5), 1572–1580. https://doi.org/10.1044/2020_JSLHR-19-00299
Gelman, A., & Carlin, J. (2014). Beyond power calculations: Assessing type S (Sign) and type M (Magnitude) errors. Perspectives on Psychological Science, 9(6), 641–651. https://doi.org/10.1177/1745691614551642
Gigerenzer, G. (2018). Statistical rituals: The replication delusion and how we got there. Advances in Methods and Practices in Psychological Science, 1(2), 198–218. https://doi.org/10.1177/2515245918771329
Giuffrida, M. A. (2014). Type II error and statistical power in reports of small animal clinical trials. Journal of the American Veterinary Medical Association, 244(9), 1075–1080. https://doi.org/10.2460/javma.244.9.1075
Greenland, S., Senn, S. J., Rothman, K. J., Carlin, J. B., Poole, C., Goodman, S. N., & Altman, D. G. (2016). Statistical tests, P values, confidence intervals, and power: A guide to misinterpretations. European Journal of Epidemiology, 31(4), 337–350. https://doi.org/10.1007/s10654-016-0149-3
Hackshaw, A. (2008). Small studies: Strengths and limitations. European Respiratory Journal, 32(5), 1141–1143. https://doi.org/10.1183/09031936.00136408
Halsey, L. G., Curran-Everett, D., Vowler, S. L., & Drummond, G. B. (2015). The fickle P value generates irreproducible results. Nature Methods, 12(3), 179–185. https://doi.org/10.1038/nmeth.3288
Henderson, E. J., Morgan, G. S., Amin, J., Gaunt, D. M., & Ben-Shlomo, Y. (2019). The minimum clinically important difference (MCID) for a falls intervention in Parkinson’s: A delphi study. Parkinsonism & Related Disorders, 61, 106–110. https://doi.org/10.1016/j.parkreldis.2018.11.008
Hofmeister, E. H., King, J., Read, M. R., & Budsberg, S. C. (2007). Sample size and statistical power in the small-animal analgesia literature. Journal of Small Animal Practice, 48(2), 76–79. https://doi.org/10.1111/j.1748-5827.2006.00234.x
Huang, W., Percie du Sert, N., Vollert, J., & Rice, A. S. C. (2020). General principles of preclinical study design. In A. Bespalov, M. C. Michel, & T. Steckler (Eds.), Good research practice in non-clinical pharmacology and biomedicine (pp. 55–69). Springer International Publishing. https://doi.org/10.1007/164_2019_277
Hussey, I. (2023). A systematic review of null hypothesis significance testing, sample sizes, and statistical power in research using the Implicit Relational Assessment Procedure. Journal of Contextual Behavioral Science, 29, 86–97. https://doi.org/10.1016/j.jcbs.2023.06.008
Ioannidis, J. P. A. (2005). Why most published research findings are false. PLoS Medicine, 19(8), e124. https://doi.org/10.1371/journal.pmed.0020124
Ioannidis, J. P. A. (2008). Why most discovered true associations are inflated. Epidemiology, 19(5), 640–648. https://doi.org/10.1097/EDE.0b013e31818131e7
Ioannidis, J. P. A. (2014). How to make more published research true. PLOS Medicine, 11(10), Article e1001747. https://doi.org/10.1371/journal.pmed.1001747
Ioannidis, J. P. A., Stanley, T. D., & Doucouliagos, H. (2017). The power of bias in economics research. The Economic Journal, 127(605), F236–F265. https://doi.org/10.1111/ecoj.12461
Jennions, M., & Moller, A. (2003). A survey of the statistical power of research in behavioral ecology and animal behavior. Behavioral Ecology, 14(3), 438–445. https://doi.org/10.1093/beheco/14.3.438
John, L. K., Loewenstein, G., & Prelec, D. (2012). Measuring the prevalence of questionable research practices with incentives for truth telling. Psychological Science, 23(5), 524–532. https://doi.org/10.1177/0956797611430953
Jonasson, Z. (2005). Meta-analysis of sex differences in rodent models of learning and memory: A review of behavioral and biological data. Neuroscience & Biobehavioral Reviews, 28(8), 811–825. https://doi.org/10.1016/j.neubiorev.2004.10.006
Kinney, A. R., Eakman, A. M., & Graham, J. E. (2020). Novel effect size interpretation guidelines and an evaluation of statistical power in rehabilitation research. Archives of Physical Medicine and Rehabilitation, 101(12), 2219–2226. https://doi.org/10.1016/j.apmr.2020.02.017
Klukowska, A. M., Vandertop, W. P., Schröder, M. L., & Staartjes, V. E. (2024). Calculation of the minimum clinically important difference (MCID) using different methodologies: Case study and practical guide. European Spine Journal, 33, 3388–3400. https://doi.org/10.1007/s00586-024-08369-5
Kraemer, H. C., & Kupfer, D. J. (2006). Size of treatment effects and their importance to clinical research and practice. Biological Psychiatry, 59(11), 990–996. https://doi.org/10.1016/j.biopsych.2005.09.014
Kühberger, A., Fritz, A., & Scherndl, T. (2014). Publication bias in psychology: A diagnosis based on the correlation between effect size and sample size. PLOS One, 9(9), Article e105825. https://doi.org/10.1371/journal.pone.0105825
Lakens, D. (2022). Sample size justification. Collabra: Psychology, 8(1), Article 33267. https://doi.org/10.1525/collabra.33267
Lamberink, H. J., Otte, W. M., Sinke, M. R. T., Lakens, D., Glasziou, P. P., Tijdink, J. K., & Vinkers, C. H. (2018). Statistical power of clinical trials increased while effect size remained stable: An empirical analysis of 136,212 clinical trials between 1975 and 2014. Journal of Clinical Epidemiology, 102, 123–128. https://doi.org/10.1016/j.jclinepi.2018.06.014
Lenth, R. V. (2001). Some practical guidelines for effective sample size determination. The American Statistician, 55(3), 187–193. https://doi.org/10.1198/000313001317098149
Lodder, P., Ong, H. H., Grasman, R. P. P. P., & Wicherts, J. M. (2019). A comprehensive meta-analysis of money priming. Journal of Experimental Psychology: General, 148(4), 688–712. http://dx.doi.org/10.1037/xge0000570
Lymer, J., Bergman, H., Yang, S., Mallick, R., Galea, L. A. M., Choleris, E., & Fergusson, D. (2024). The effects of estrogens on spatial learning and memory in female rodents – A systematic review and meta-analysis. Hormones and Behavior, 164, Article 105598. https://doi.org/10.1016/j.yhbeh.2024.105598
Lytsy, P., Hartman, M., & Pingel, R. (2022). Misinterpretations of P-values and statistical tests persist among researchers and professionals working with statistics and epidemiology. Upsala Journal of Medical Sciences, 127(1), Article e8760. https://doi.org/10.48101/ujms.v127.8760
Man-Son-Hing, M., Laupacis, A., O’Rourke, K., Molnar, F. J., Mahon, J., Chan, K. B. Y., & Wells, G. (2002). Determination of the clinical importance of study results. Journal of General Internal Medicine, 17, 469–476. https://doi.org/10.1046/j.1525-1497.2002.11111.x
Mitra, S., Mehta, U. M., Binukumar, B., Venkatasubramanian, G., & Thirthalli, J. (2019). Statistical power estimation in non-invasive brain stimulation studies and its clinical implications: An exploratory study of the meta-analyses. Asian Journal of Psychiatry, 44, 29–34. https://doi.org/10.1016/j.ajp.2019.07.006
Moher, D., Dulberg, C. S., & Wells, G. A. (1994). Statistical power, sample size, and their reporting in randomized controlled trials. JAMA, 272(2), 122–124. https://doi.org/10.1001/jama.1994.03520020048013
Motulsky, H. J. (2014). Common misconceptions about data analysis and statistics. The Journal of Pharmacology and Experimental Therapeutics, 351(1), 200–205. https://doi.org/10.1124/jpet.114.219170
Munafò, M. R., Nosek, B. A., Bishop, D. V. M., Button, K. S., Chambers, C. D., Percie du Sert, N., Simonsohn, U., Wagenmakers, E.J., Ware, J. J., & Ioannidis, J. P. A. (2017). A manifesto for reproducible science. Nature Human Behaviour, 1, Article 0021. https://doi.org/10.1038/s41562-016-0021
Nieuwenhuis, S., Forstmann, B. U., & Wagenmakers, E.J. (2011). Erroneous analyses of interactions in neuroscience: A problem of significance. Nature Neuroscience, 14(9), 1105–1107. https://doi.org/10.1038/nn.2886
Nord, C. L., Valton, V., Wood, J., & Roiser, J. P. (2017). Power-up: A reanalysis of “Power Failure” in neuroscience using mixture modeling. The Journal of Neuroscience, 37(34), 8051–8061. https://doi.org/10.1523/JNEUROSCI.3592-16.2017
Open Science Collaboration. (2015). Estimating the reproducibility of psychological science. Science, 349(6251), Article aac4716. https://doi.org/10.1126/science.aac4716
Patel, C. J., Burford, B., & Ioannidis, J. P. A. (2015). Assessment of vibration of effects due to model specification can demonstrate the instability of observational associations. Journal of Clinical Epidemiology, 68(9), 1046–1058. https://doi.org/10.1016/j.jclinepi.2015.05.029
Percie du Sert, N., Ahluwalia, A., Alam, S., Avey, M. T., Baker, M., Browne, W. J., Clark, A., Cuthill, I. C., Dirnagl, U., Emerson, M., Garner, P., Holgate, S. T., Howells, D. W., Hurst, V., Karp, N. A., Lazic, S. E., Lidster, K., MacCallum, C. J., Macleod, M., … Würbel, H. (2020). Reporting animal research: Explanation and elaboration for the ARRIVE guidelines 2.0. PLOS Biology, 18(7), Article e3000411. https://doi.org/10.1371/journal.pbio.3000411
Pereira, T. V., & Ioannidis, J. P. A. (2011). Statistically significant meta-analyses of clinical trials have modest credibility and inflated effects. Journal of Clinical Epidemiology, 64(10), 1060–1069. https://doi.org/10.1016/j.jclinepi.2010.12.012
Perugini, M., Gallucci, M., & Costantini, G. (2014). Safeguard power as a protection against imprecise power estimates. Perspectives on Psychological Science, 9(3), 319–332. https://doi.org/10.1177/1745691614528519
Prus, A. J., James, J. R., & Rosecrans, J. A. (2009). Conditioned place preference. In J. J. Buccafusco (Ed.), Methods of behavior analysis in neuroscience (2nd ed.). CRC Press/Taylor & Francis. http://www.ncbi.nlm.nih.gov/books/NBK5229/
Quintana, D. S. (2020). Most oxytocin administration studies are statistically underpowered to reliably detect (or reject) a wide range of effect sizes. Comprehensive Psychoneuroendocrinology, 4, Article 100014. https://doi.org/10.1016/j.cpnec.2020.100014
R Development Core Team. (2025). R: A Language and Environment for Statistical Computing [Computer software]. R Foundation for Statistical Computing. http://www.R-project.org
Reynolds, P. S. (2024). A guide to sample size for animal-based studies. Wiley-Blackwell.
Robey, R. R. (2004). Reporting point and interval estimates of effect-size for planned contrasts: Fixed within effect analyses of variance. Journal of Fluency Disorders, 29(4), 307–341. https://doi.org/10.1016/j.jfludis.2004.10.005
Sassenberg, K., & Ditrich, L. (2019). Research in social psychology changed between 2011 and 2016: Larger sample sizes, more self-report measures, and more online studies. Advances in Methods and Practices in Psychological Science, 2(2), 107–114. https://doi.org/10.1177/2515245919838781
Sawilowsky, S. (2009). New effect size rules of thumb. Journal of Modern Applied Statistical Methods, 8(2), 467–474. https://doi.org/10.22237%2Fjmasm%2F1257035100
Schäfer, T., & Schwarz, M. A. (2019). The meaningfulness of effect sizes in psychological research: Differences between sub-disciplines and the impact of potential biases. Frontiers in Psychology, 10, Article 813. https://doi.org/10.3389/fpsyg.2019.00813
Schmidt-Pogoda, A., Bonberg, N., Koecke, M. H. M., Strecker, J.-K., Wellmann, J., Bruckmann, N.-M., Beuker, C., Schäbitz, W.-R., Meuth, S. G., Wiendl, H., Minnerup, H., & Minnerup, J. (2019). Why most acute stroke studies are positive in animals but not in patients: A systematic comparison of preclinical, early phase, and phase 3 clinical trials of neuroprotective agents. Annals of Neurology, 87(1), 40-51. https://doi.org/10.1002/ana.25643
Schneck, A. (2023). Are most published research findings false? Trends in statistical power, publication selection bias, and the false discovery rate in psychology (1975–2017). PLOS One, 18(10), Article e0292717. https://doi.org/10.1371/journal.pone.0292717
Simmons, J. P., Nelson, L. D., & Simonsohn, U. (2011). False-positive psychology: Undisclosed flexibility in data collection and analysis allows presenting anything as significant. Psychological Science, 22(11), 1359–1366. https://doi.org/10.1177/0956797611417632
Smith, D. R., Hardy, I. C. W., & Gammell, M. P. (2011). Power rangers: No improvement in the statistical power of analyses published in Animal Behaviour. Animal Behaviour, 81(1), 347–352. https://doi.org/10.1016/j.anbehav.2010.09.026
Smith, P. F. (2017). A guerilla guide to common problems in ‘neurostatistics’: Essential statistical topics in neuroscience. Journal of Undergraduate Neuroscience Education, 16(1), R1–R12.
Stanley, T. D., Carter, E. C., & Doucouliagos, H. (2018). What meta-analyses reveal about the replicability of psychological research. Psychological Bulletin, 144(12), 1325–1346. https://doi.org/10.1037/bul0000169
Szucs, D., & Ioannidis, J. P. A. (2017). Empirical assessment of published effect sizes and power in the recent cognitive neuroscience and psychology literature. PLOS Biology, 15(3), Article e2000797. https://doi.org/10.1371/journal.pbio.2000797
Turner, R. M., Bird, S. M., & Higgins, J. P. T. (2013). The impact of study size on meta-analyses: Examination of underpowered studies in Cochrane reviews. PLOS One, 8(3), Article e59202. https://doi.org/10.1371/journal.pone.0059202
van Calster, B., Wynants, L., Riley, R. D., van Smeden, M., & Collins, G. S. (2021). Methodology over metrics: Current scientific standards are a disservice to patients and society. Journal of Clinical Epidemiology, 138, 219–226. https://doi.org/10.1016/j.jclinepi.2021.05.018
Vesterinen, H. M., Sena, E. S., Ffrench-Constant, C., Williams, A., Chandran, S., & Macleod, M. R. (2010). Improving the translational hit of experimental treatments in multiple sclerosis. Multiple Sclerosis Journal, 16(9), 1044–1055. https://doi.org/10.1177/1352458510379612
Voelkl, B., Vogt, L., Sena, E. S., & Würbel, H. (2018). Reproducibility of preclinical animal research improves with heterogeneity of study samples. PLOS Biology, 16(2), Article e2003693. https://doi.org/10.1371/journal.pbio.2003693
Walum, H., Waldman, I. D., & Young, L. J. (2016). Statistical and methodological considerations for the interpretation of intranasal oxytocin studies. Biological Psychiatry, 79(3), 251–257. https://doi.org/10.1016/j.biopsych.2015.06.016
Wilson, B. M., & Wixted, J. T. (2018). The prior odds of testing a true effect in cognitive and social psychology. Advances in Methods and Practices in Psychological Science, 1(2), 186–197. https://doi.org/10.1177/2515245918767122
Yang, Y., Sánchez-Tójar, A., O’Dea, R. E., Noble, D. W. A., Koricheva, J., Jennions, M. D., Parker, T. H., Lagisz, M., & Nakagawa, S. (2023). Publication bias impacts on effect size, statistical power, and magnitude (Type M) and sign (Type S) errors in ecology and evolutionary biology. BMC Biology, 21(1), Article 71. https://doi.org/10.1186/s12915-022-01485-y
Yarkoni, T. (2009). Big correlations in little studies: Inflated fMRI correlations reflect low statistical power — Commentary on Vul et al. (2009). Perspectives on Psychological Science, 4(3), 294–298. https://doi.org/10.1111/j.1745-6924.2009.01127.x
Yates, J. R. (2023). Quantifying conditioned place preference: A review of current analyses and a proposal for a novel approach. Frontiers in Behavioral Neuroscience, 17, Article 1256764. https://doi.org/10.3389/fnbeh.2023.1256764
Zhang, Z., & Yuang, K. (2018). Practical statistical power analysis using WebPower and R (K.-H. Yuan, Ed.). ISDSA Press.
Zhang, Z., Mai, Y., Yang, M., Xu, Z., & McNamara, C. (2023). WebPower: Basic and Advanced Statistical Power Analysis (0.9.4) [Computer software]. https://cran.r-project.org/web/packages/WebPower/index.html